West Indian vs Immigrants from Trinidad and Tobago Ambulatory Disability
COMPARE
West Indian
Immigrants from Trinidad and Tobago
Ambulatory Disability
Ambulatory Disability Comparison
West Indians
Immigrants from Trinidad and Tobago
6.9%
AMBULATORY DISABILITY
0.0/ 100
METRIC RATING
291st/ 347
METRIC RANK
6.7%
AMBULATORY DISABILITY
0.1/ 100
METRIC RATING
271st/ 347
METRIC RANK
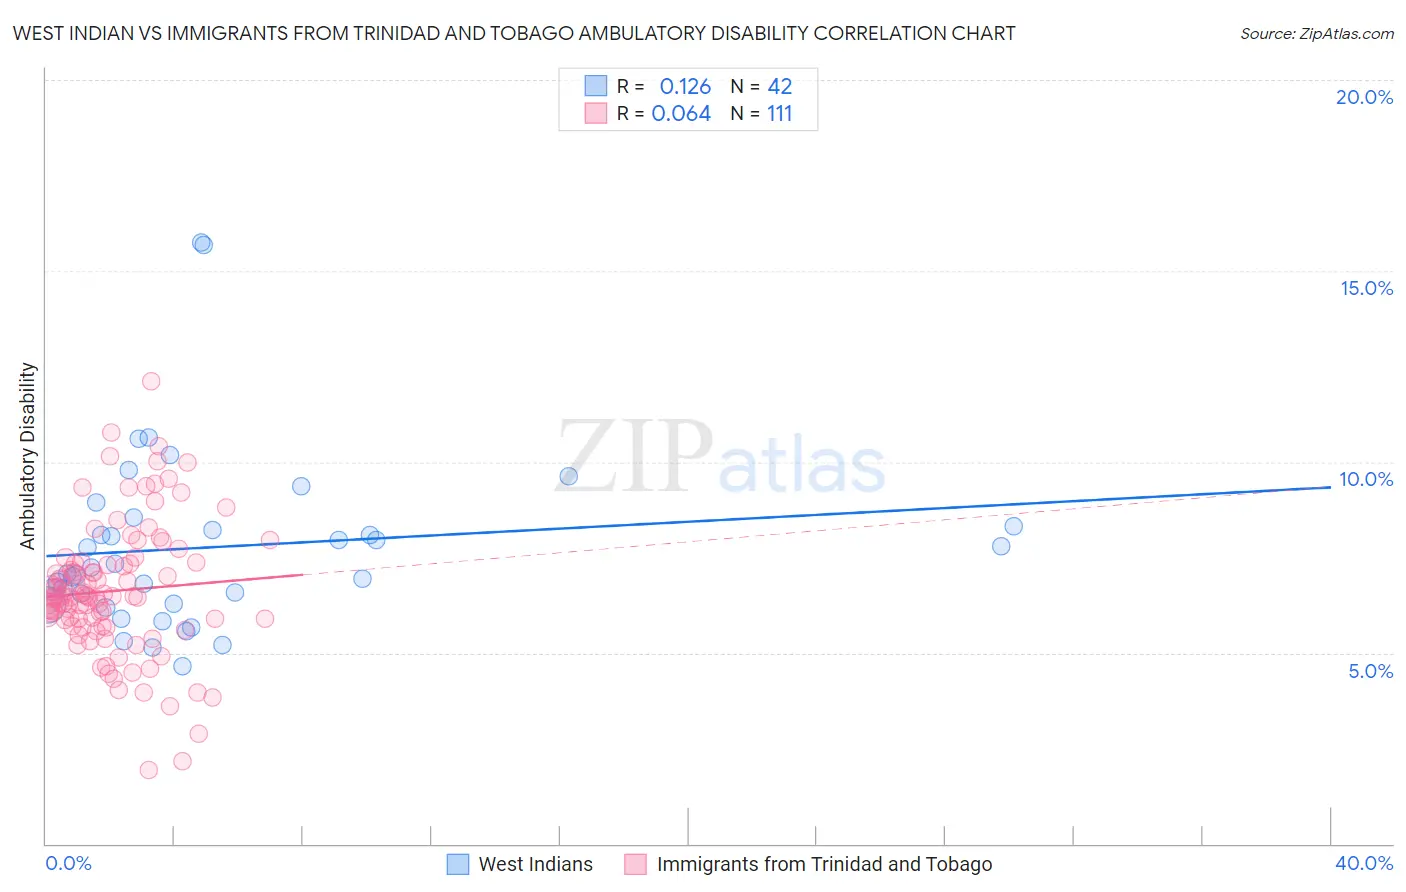
West Indian vs Immigrants from Trinidad and Tobago Ambulatory Disability Correlation Chart
The statistical analysis conducted on geographies consisting of 253,984,061 people shows a poor positive correlation between the proportion of West Indians and percentage of population with ambulatory disability in the United States with a correlation coefficient (R) of 0.126 and weighted average of 6.9%. Similarly, the statistical analysis conducted on geographies consisting of 223,483,943 people shows a slight positive correlation between the proportion of Immigrants from Trinidad and Tobago and percentage of population with ambulatory disability in the United States with a correlation coefficient (R) of 0.064 and weighted average of 6.7%, a difference of 3.1%.
Ambulatory Disability Correlation Summary
| Measurement | West Indian | Immigrants from Trinidad and Tobago |
| Minimum | 4.7% | 1.9% |
| Maximum | 15.7% | 12.1% |
| Range | 11.1% | 10.2% |
| Mean | 7.8% | 6.6% |
| Median | 7.2% | 6.5% |
| Interquartile 25% (IQ1) | 6.3% | 5.7% |
| Interquartile 75% (IQ3) | 8.3% | 7.3% |
| Interquartile Range (IQR) | 2.0% | 1.6% |
| Standard Deviation (Sample) | 2.3% | 1.7% |
| Standard Deviation (Population) | 2.3% | 1.7% |
Demographics Similar to West Indians and Immigrants from Trinidad and Tobago by Ambulatory Disability
In terms of ambulatory disability, the demographic groups most similar to West Indians are Scotch-Irish (6.9%, a difference of 0.10%), Immigrants from Dominica (6.9%, a difference of 0.12%), Nonimmigrants (6.9%, a difference of 0.27%), U.S. Virgin Islander (6.8%, a difference of 0.54%), and Yakama (6.8%, a difference of 0.86%). Similarly, the demographic groups most similar to Immigrants from Trinidad and Tobago are French Canadian (6.7%, a difference of 0.36%), White/Caucasian (6.7%, a difference of 0.38%), Sioux (6.7%, a difference of 0.62%), Immigrants from Guyana (6.7%, a difference of 0.69%), and Celtic (6.7%, a difference of 0.72%).
| Demographics | Rating | Rank | Ambulatory Disability |
| Immigrants | Trinidad and Tobago | 0.1 /100 | #271 | Tragic 6.7% |
| French Canadians | 0.1 /100 | #272 | Tragic 6.7% |
| Whites/Caucasians | 0.1 /100 | #273 | Tragic 6.7% |
| Sioux | 0.1 /100 | #274 | Tragic 6.7% |
| Immigrants | Guyana | 0.1 /100 | #275 | Tragic 6.7% |
| Celtics | 0.1 /100 | #276 | Tragic 6.7% |
| Jamaicans | 0.1 /100 | #277 | Tragic 6.7% |
| Immigrants | West Indies | 0.1 /100 | #278 | Tragic 6.7% |
| Immigrants | Caribbean | 0.0 /100 | #279 | Tragic 6.7% |
| Pennsylvania Germans | 0.0 /100 | #280 | Tragic 6.8% |
| Yaqui | 0.0 /100 | #281 | Tragic 6.8% |
| Barbadians | 0.0 /100 | #282 | Tragic 6.8% |
| Immigrants | Barbados | 0.0 /100 | #283 | Tragic 6.8% |
| Immigrants | Jamaica | 0.0 /100 | #284 | Tragic 6.8% |
| Fijians | 0.0 /100 | #285 | Tragic 6.8% |
| Yakama | 0.0 /100 | #286 | Tragic 6.8% |
| U.S. Virgin Islanders | 0.0 /100 | #287 | Tragic 6.8% |
| Immigrants | Nonimmigrants | 0.0 /100 | #288 | Tragic 6.9% |
| Immigrants | Dominica | 0.0 /100 | #289 | Tragic 6.9% |
| Scotch-Irish | 0.0 /100 | #290 | Tragic 6.9% |
| West Indians | 0.0 /100 | #291 | Tragic 6.9% |