Macedonian vs Immigrants from Trinidad and Tobago Ambulatory Disability
COMPARE
Macedonian
Immigrants from Trinidad and Tobago
Ambulatory Disability
Ambulatory Disability Comparison
Macedonians
Immigrants from Trinidad and Tobago
6.0%
AMBULATORY DISABILITY
82.8/ 100
METRIC RATING
144th/ 347
METRIC RANK
6.7%
AMBULATORY DISABILITY
0.1/ 100
METRIC RATING
271st/ 347
METRIC RANK
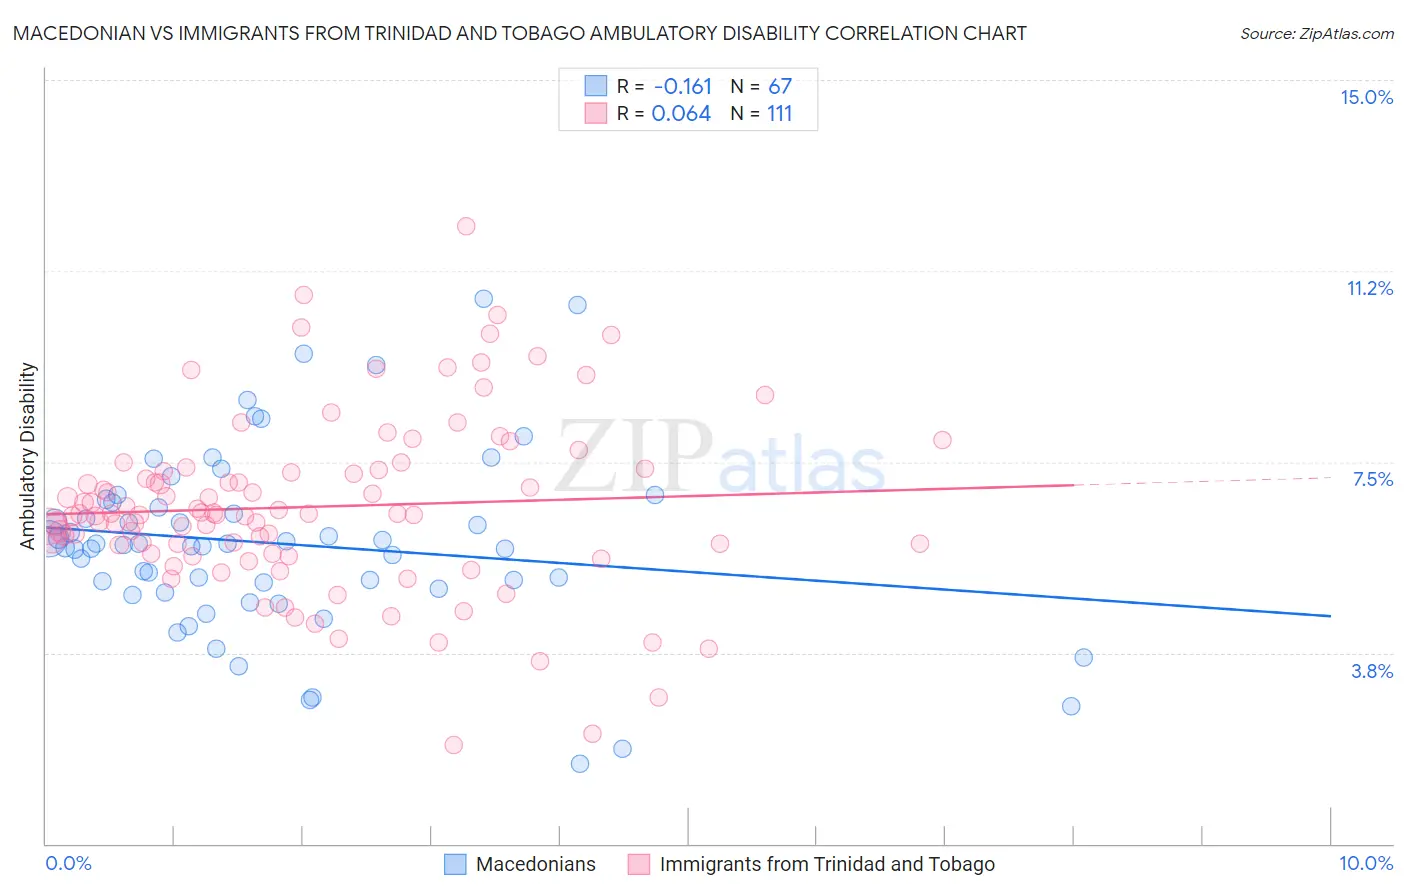
Macedonian vs Immigrants from Trinidad and Tobago Ambulatory Disability Correlation Chart
The statistical analysis conducted on geographies consisting of 132,658,712 people shows a poor negative correlation between the proportion of Macedonians and percentage of population with ambulatory disability in the United States with a correlation coefficient (R) of -0.161 and weighted average of 6.0%. Similarly, the statistical analysis conducted on geographies consisting of 223,483,943 people shows a slight positive correlation between the proportion of Immigrants from Trinidad and Tobago and percentage of population with ambulatory disability in the United States with a correlation coefficient (R) of 0.064 and weighted average of 6.7%, a difference of 11.3%.
Ambulatory Disability Correlation Summary
| Measurement | Macedonian | Immigrants from Trinidad and Tobago |
| Minimum | 1.6% | 1.9% |
| Maximum | 10.7% | 12.1% |
| Range | 9.1% | 10.2% |
| Mean | 5.9% | 6.6% |
| Median | 5.9% | 6.5% |
| Interquartile 25% (IQ1) | 5.0% | 5.7% |
| Interquartile 75% (IQ3) | 6.7% | 7.3% |
| Interquartile Range (IQR) | 1.7% | 1.6% |
| Standard Deviation (Sample) | 1.8% | 1.7% |
| Standard Deviation (Population) | 1.8% | 1.7% |
Similar Demographics by Ambulatory Disability
Demographics Similar to Macedonians by Ambulatory Disability
In terms of ambulatory disability, the demographic groups most similar to Macedonians are Romanian (6.0%, a difference of 0.010%), Immigrants from Philippines (6.0%, a difference of 0.020%), Swedish (6.0%, a difference of 0.030%), Pakistani (6.0%, a difference of 0.030%), and Immigrants from Greece (6.0%, a difference of 0.030%).
| Demographics | Rating | Rank | Ambulatory Disability |
| Immigrants | Syria | 84.1 /100 | #137 | Excellent 6.0% |
| Immigrants | Hungary | 83.9 /100 | #138 | Excellent 6.0% |
| Immigrants | Zaire | 83.6 /100 | #139 | Excellent 6.0% |
| Czechs | 83.3 /100 | #140 | Excellent 6.0% |
| Swedes | 83.1 /100 | #141 | Excellent 6.0% |
| Immigrants | Philippines | 83.0 /100 | #142 | Excellent 6.0% |
| Romanians | 82.9 /100 | #143 | Excellent 6.0% |
| Macedonians | 82.8 /100 | #144 | Excellent 6.0% |
| Pakistanis | 82.5 /100 | #145 | Excellent 6.0% |
| Immigrants | Greece | 82.5 /100 | #146 | Excellent 6.0% |
| Immigrants | Moldova | 82.4 /100 | #147 | Excellent 6.0% |
| Immigrants | Eastern Europe | 82.0 /100 | #148 | Excellent 6.0% |
| Lithuanians | 81.9 /100 | #149 | Excellent 6.0% |
| Maltese | 81.6 /100 | #150 | Excellent 6.0% |
| Greeks | 79.6 /100 | #151 | Good 6.0% |
Demographics Similar to Immigrants from Trinidad and Tobago by Ambulatory Disability
In terms of ambulatory disability, the demographic groups most similar to Immigrants from Trinidad and Tobago are Slovak (6.7%, a difference of 0.10%), French (6.6%, a difference of 0.26%), French Canadian (6.7%, a difference of 0.36%), White/Caucasian (6.7%, a difference of 0.38%), and Spanish (6.6%, a difference of 0.56%).
| Demographics | Rating | Rank | Ambulatory Disability |
| Nepalese | 0.2 /100 | #264 | Tragic 6.6% |
| Bahamians | 0.2 /100 | #265 | Tragic 6.6% |
| Guyanese | 0.2 /100 | #266 | Tragic 6.6% |
| Trinidadians and Tobagonians | 0.2 /100 | #267 | Tragic 6.6% |
| Spanish | 0.2 /100 | #268 | Tragic 6.6% |
| French | 0.1 /100 | #269 | Tragic 6.6% |
| Slovaks | 0.1 /100 | #270 | Tragic 6.7% |
| Immigrants | Trinidad and Tobago | 0.1 /100 | #271 | Tragic 6.7% |
| French Canadians | 0.1 /100 | #272 | Tragic 6.7% |
| Whites/Caucasians | 0.1 /100 | #273 | Tragic 6.7% |
| Sioux | 0.1 /100 | #274 | Tragic 6.7% |
| Immigrants | Guyana | 0.1 /100 | #275 | Tragic 6.7% |
| Celtics | 0.1 /100 | #276 | Tragic 6.7% |
| Jamaicans | 0.1 /100 | #277 | Tragic 6.7% |
| Immigrants | West Indies | 0.1 /100 | #278 | Tragic 6.7% |