British vs Immigrants from Trinidad and Tobago Ambulatory Disability
COMPARE
British
Immigrants from Trinidad and Tobago
Ambulatory Disability
Ambulatory Disability Comparison
British
Immigrants from Trinidad and Tobago
6.2%
AMBULATORY DISABILITY
34.3/ 100
METRIC RATING
188th/ 347
METRIC RANK
6.7%
AMBULATORY DISABILITY
0.1/ 100
METRIC RATING
271st/ 347
METRIC RANK
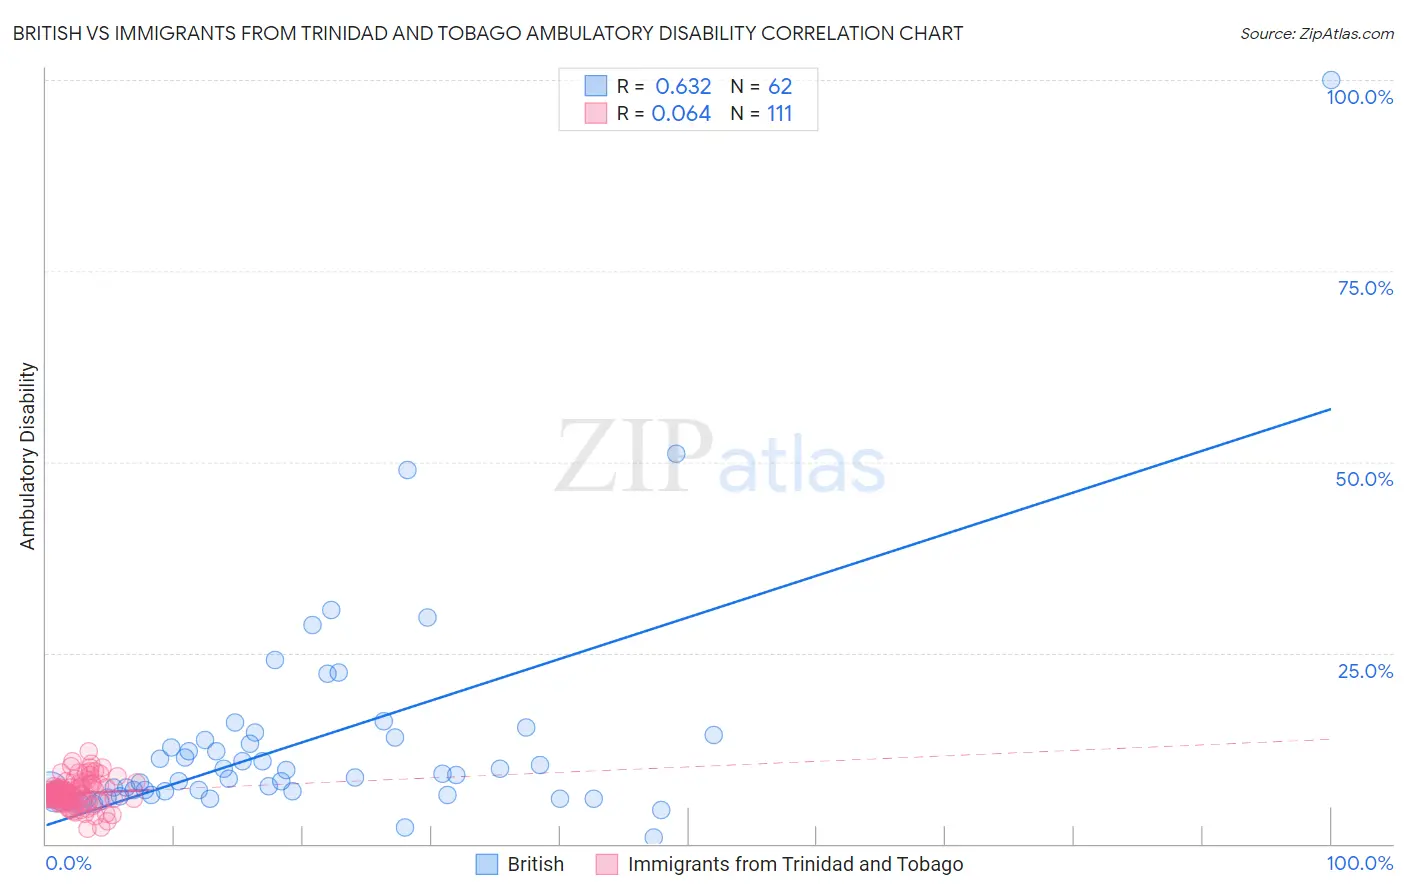
British vs Immigrants from Trinidad and Tobago Ambulatory Disability Correlation Chart
The statistical analysis conducted on geographies consisting of 531,154,282 people shows a significant positive correlation between the proportion of British and percentage of population with ambulatory disability in the United States with a correlation coefficient (R) of 0.632 and weighted average of 6.2%. Similarly, the statistical analysis conducted on geographies consisting of 223,483,943 people shows a slight positive correlation between the proportion of Immigrants from Trinidad and Tobago and percentage of population with ambulatory disability in the United States with a correlation coefficient (R) of 0.064 and weighted average of 6.7%, a difference of 8.0%.
Ambulatory Disability Correlation Summary
| Measurement | British | Immigrants from Trinidad and Tobago |
| Minimum | 0.87% | 1.9% |
| Maximum | 100.0% | 12.1% |
| Range | 99.1% | 10.2% |
| Mean | 13.1% | 6.6% |
| Median | 8.6% | 6.5% |
| Interquartile 25% (IQ1) | 6.3% | 5.7% |
| Interquartile 75% (IQ3) | 13.6% | 7.3% |
| Interquartile Range (IQR) | 7.3% | 1.6% |
| Standard Deviation (Sample) | 14.6% | 1.7% |
| Standard Deviation (Population) | 14.5% | 1.7% |
Similar Demographics by Ambulatory Disability
Demographics Similar to British by Ambulatory Disability
In terms of ambulatory disability, the demographic groups most similar to British are Ukrainian (6.2%, a difference of 0.020%), Immigrants from Western Africa (6.2%, a difference of 0.050%), Carpatho Rusyn (6.2%, a difference of 0.060%), European (6.2%, a difference of 0.11%), and Immigrants from Guatemala (6.2%, a difference of 0.14%).
| Demographics | Rating | Rank | Ambulatory Disability |
| Swiss | 43.1 /100 | #181 | Average 6.1% |
| Serbians | 42.8 /100 | #182 | Average 6.1% |
| Immigrants | Thailand | 42.2 /100 | #183 | Average 6.1% |
| Immigrants | Ghana | 41.2 /100 | #184 | Average 6.1% |
| Immigrants | Bosnia and Herzegovina | 37.2 /100 | #185 | Fair 6.2% |
| Europeans | 36.2 /100 | #186 | Fair 6.2% |
| Carpatho Rusyns | 35.3 /100 | #187 | Fair 6.2% |
| British | 34.3 /100 | #188 | Fair 6.2% |
| Ukrainians | 34.0 /100 | #189 | Fair 6.2% |
| Immigrants | Western Africa | 33.4 /100 | #190 | Fair 6.2% |
| Immigrants | Guatemala | 31.9 /100 | #191 | Fair 6.2% |
| Immigrants | Western Europe | 31.6 /100 | #192 | Fair 6.2% |
| Guatemalans | 30.0 /100 | #193 | Fair 6.2% |
| Alaska Natives | 29.8 /100 | #194 | Fair 6.2% |
| Belgians | 28.6 /100 | #195 | Fair 6.2% |
Demographics Similar to Immigrants from Trinidad and Tobago by Ambulatory Disability
In terms of ambulatory disability, the demographic groups most similar to Immigrants from Trinidad and Tobago are Slovak (6.7%, a difference of 0.10%), French (6.6%, a difference of 0.26%), French Canadian (6.7%, a difference of 0.36%), White/Caucasian (6.7%, a difference of 0.38%), and Spanish (6.6%, a difference of 0.56%).
| Demographics | Rating | Rank | Ambulatory Disability |
| Nepalese | 0.2 /100 | #264 | Tragic 6.6% |
| Bahamians | 0.2 /100 | #265 | Tragic 6.6% |
| Guyanese | 0.2 /100 | #266 | Tragic 6.6% |
| Trinidadians and Tobagonians | 0.2 /100 | #267 | Tragic 6.6% |
| Spanish | 0.2 /100 | #268 | Tragic 6.6% |
| French | 0.1 /100 | #269 | Tragic 6.6% |
| Slovaks | 0.1 /100 | #270 | Tragic 6.7% |
| Immigrants | Trinidad and Tobago | 0.1 /100 | #271 | Tragic 6.7% |
| French Canadians | 0.1 /100 | #272 | Tragic 6.7% |
| Whites/Caucasians | 0.1 /100 | #273 | Tragic 6.7% |
| Sioux | 0.1 /100 | #274 | Tragic 6.7% |
| Immigrants | Guyana | 0.1 /100 | #275 | Tragic 6.7% |
| Celtics | 0.1 /100 | #276 | Tragic 6.7% |
| Jamaicans | 0.1 /100 | #277 | Tragic 6.7% |
| Immigrants | West Indies | 0.1 /100 | #278 | Tragic 6.7% |