Colombian vs Trinidadian and Tobagonian Cognitive Disability
COMPARE
Colombian
Trinidadian and Tobagonian
Cognitive Disability
Cognitive Disability Comparison
Colombians
Trinidadians and Tobagonians
16.6%
COGNITIVE DISABILITY
99.6/ 100
METRIC RATING
65th/ 347
METRIC RANK
17.9%
COGNITIVE DISABILITY
0.8/ 100
METRIC RATING
245th/ 347
METRIC RANK
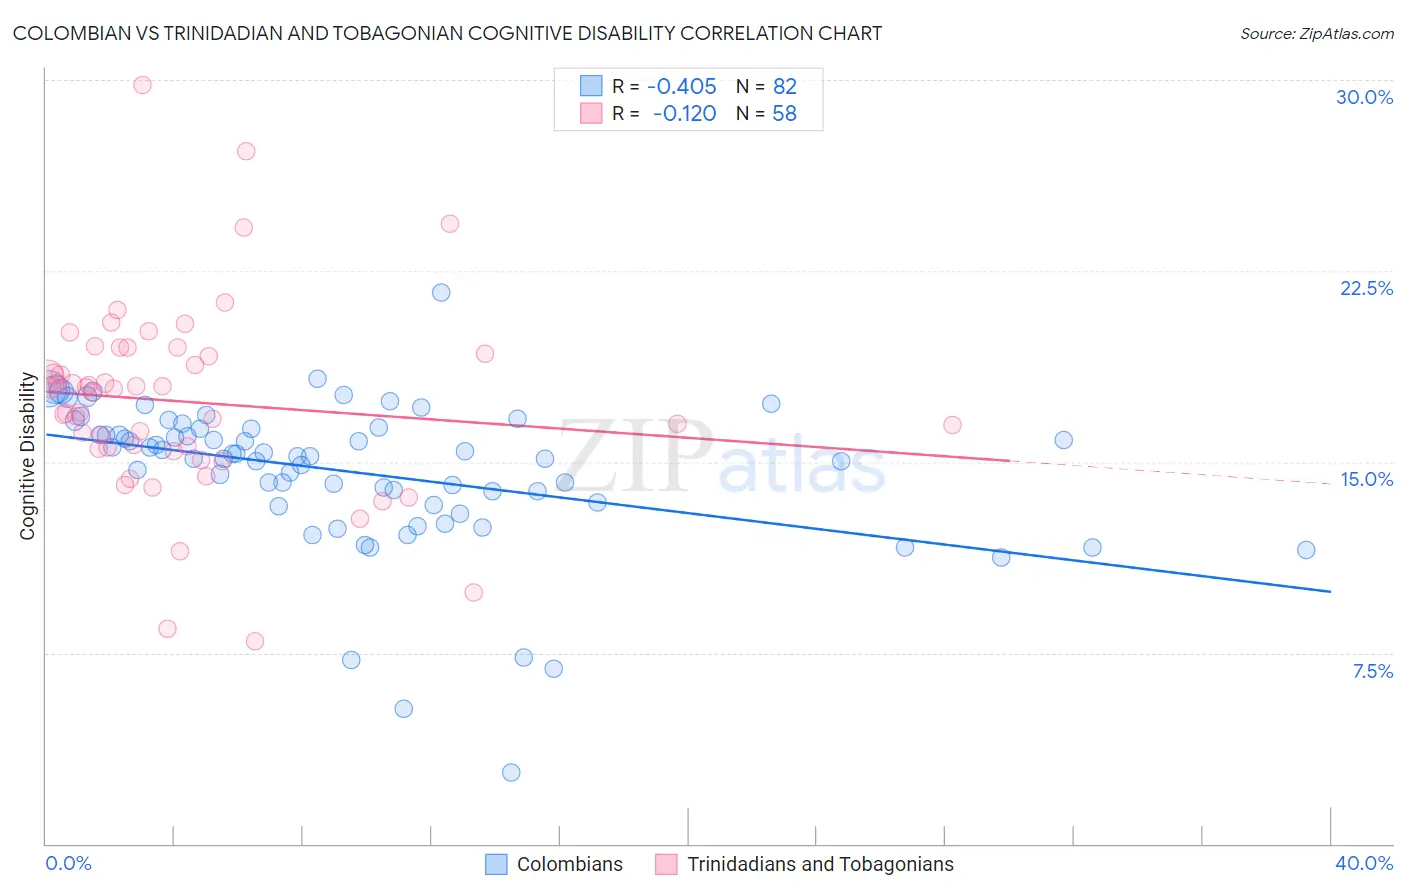
Colombian vs Trinidadian and Tobagonian Cognitive Disability Correlation Chart
The statistical analysis conducted on geographies consisting of 419,606,115 people shows a moderate negative correlation between the proportion of Colombians and percentage of population with cognitive disability in the United States with a correlation coefficient (R) of -0.405 and weighted average of 16.6%. Similarly, the statistical analysis conducted on geographies consisting of 219,836,057 people shows a poor negative correlation between the proportion of Trinidadians and Tobagonians and percentage of population with cognitive disability in the United States with a correlation coefficient (R) of -0.120 and weighted average of 17.9%, a difference of 7.6%.
Cognitive Disability Correlation Summary
| Measurement | Colombian | Trinidadian and Tobagonian |
| Minimum | 2.8% | 7.9% |
| Maximum | 21.7% | 29.8% |
| Range | 18.9% | 21.9% |
| Mean | 14.6% | 17.4% |
| Median | 15.3% | 17.8% |
| Interquartile 25% (IQ1) | 13.4% | 15.5% |
| Interquartile 75% (IQ3) | 16.3% | 19.2% |
| Interquartile Range (IQR) | 2.9% | 3.7% |
| Standard Deviation (Sample) | 3.0% | 3.8% |
| Standard Deviation (Population) | 2.9% | 3.8% |
Similar Demographics by Cognitive Disability
Demographics Similar to Colombians by Cognitive Disability
In terms of cognitive disability, the demographic groups most similar to Colombians are Venezuelan (16.6%, a difference of 0.010%), Argentinean (16.6%, a difference of 0.070%), Czechoslovakian (16.6%, a difference of 0.10%), Immigrants from Ukraine (16.6%, a difference of 0.12%), and Immigrants from England (16.6%, a difference of 0.13%).
| Demographics | Rating | Rank | Cognitive Disability |
| Pennsylvania Germans | 99.7 /100 | #58 | Exceptional 16.6% |
| Immigrants | Peru | 99.7 /100 | #59 | Exceptional 16.6% |
| Romanians | 99.7 /100 | #60 | Exceptional 16.6% |
| Immigrants | England | 99.6 /100 | #61 | Exceptional 16.6% |
| Czechoslovakians | 99.6 /100 | #62 | Exceptional 16.6% |
| Argentineans | 99.6 /100 | #63 | Exceptional 16.6% |
| Venezuelans | 99.6 /100 | #64 | Exceptional 16.6% |
| Colombians | 99.6 /100 | #65 | Exceptional 16.6% |
| Immigrants | Ukraine | 99.5 /100 | #66 | Exceptional 16.6% |
| Latvians | 99.5 /100 | #67 | Exceptional 16.6% |
| Ukrainians | 99.4 /100 | #68 | Exceptional 16.6% |
| Immigrants | Uzbekistan | 99.4 /100 | #69 | Exceptional 16.7% |
| Immigrants | Sweden | 99.4 /100 | #70 | Exceptional 16.7% |
| Immigrants | Belgium | 99.3 /100 | #71 | Exceptional 16.7% |
| Germans | 99.3 /100 | #72 | Exceptional 16.7% |
Demographics Similar to Trinidadians and Tobagonians by Cognitive Disability
In terms of cognitive disability, the demographic groups most similar to Trinidadians and Tobagonians are Immigrants from Thailand (17.9%, a difference of 0.020%), Jamaican (17.9%, a difference of 0.090%), Samoan (17.9%, a difference of 0.090%), French American Indian (17.9%, a difference of 0.10%), and Immigrants from Bangladesh (17.8%, a difference of 0.13%).
| Demographics | Rating | Rank | Cognitive Disability |
| Cheyenne | 1.7 /100 | #238 | Tragic 17.8% |
| Cajuns | 1.4 /100 | #239 | Tragic 17.8% |
| Iraqis | 1.4 /100 | #240 | Tragic 17.8% |
| Mexicans | 1.1 /100 | #241 | Tragic 17.8% |
| Paiute | 1.1 /100 | #242 | Tragic 17.8% |
| Immigrants | Bangladesh | 1.0 /100 | #243 | Tragic 17.8% |
| Jamaicans | 0.9 /100 | #244 | Tragic 17.9% |
| Trinidadians and Tobagonians | 0.8 /100 | #245 | Tragic 17.9% |
| Immigrants | Thailand | 0.8 /100 | #246 | Tragic 17.9% |
| Samoans | 0.7 /100 | #247 | Tragic 17.9% |
| French American Indians | 0.7 /100 | #248 | Tragic 17.9% |
| Cree | 0.7 /100 | #249 | Tragic 17.9% |
| Immigrants | Ethiopia | 0.7 /100 | #250 | Tragic 17.9% |
| Malaysians | 0.6 /100 | #251 | Tragic 17.9% |
| Immigrants | Grenada | 0.6 /100 | #252 | Tragic 17.9% |