Colombian vs Slovak Cognitive Disability
COMPARE
Colombian
Slovak
Cognitive Disability
Cognitive Disability Comparison
Colombians
Slovaks
16.6%
COGNITIVE DISABILITY
99.6/ 100
METRIC RATING
65th/ 347
METRIC RANK
16.4%
COGNITIVE DISABILITY
99.9/ 100
METRIC RATING
35th/ 347
METRIC RANK
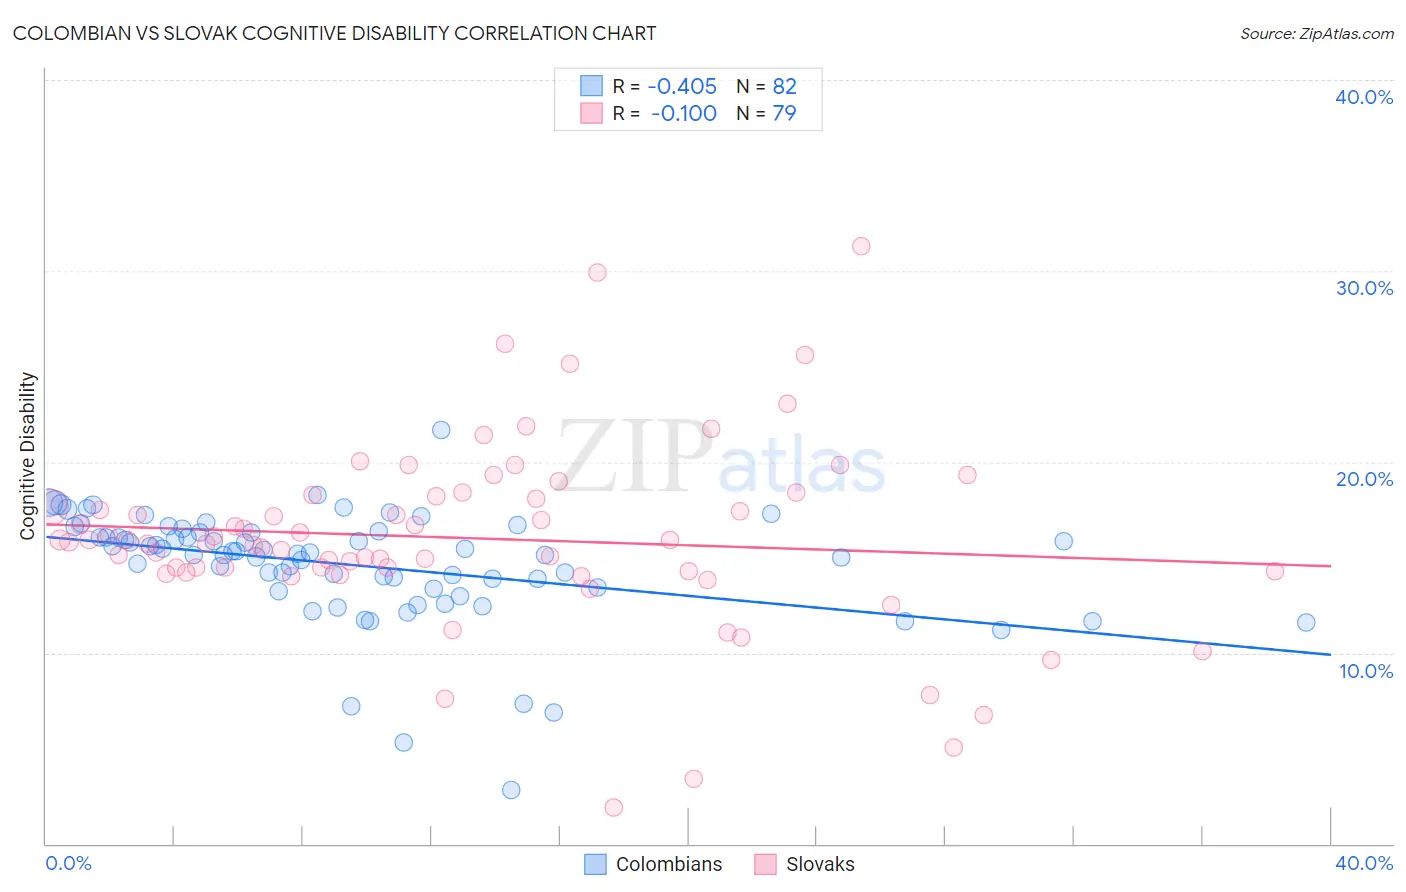
Colombian vs Slovak Cognitive Disability Correlation Chart
The statistical analysis conducted on geographies consisting of 419,606,115 people shows a moderate negative correlation between the proportion of Colombians and percentage of population with cognitive disability in the United States with a correlation coefficient (R) of -0.405 and weighted average of 16.6%. Similarly, the statistical analysis conducted on geographies consisting of 397,859,059 people shows a slight negative correlation between the proportion of Slovaks and percentage of population with cognitive disability in the United States with a correlation coefficient (R) of -0.100 and weighted average of 16.4%, a difference of 1.1%.
Cognitive Disability Correlation Summary
| Measurement | Colombian | Slovak |
| Minimum | 2.8% | 1.9% |
| Maximum | 21.7% | 31.3% |
| Range | 18.9% | 29.4% |
| Mean | 14.6% | 16.0% |
| Median | 15.3% | 15.8% |
| Interquartile 25% (IQ1) | 13.4% | 14.2% |
| Interquartile 75% (IQ3) | 16.3% | 18.2% |
| Interquartile Range (IQR) | 2.9% | 3.9% |
| Standard Deviation (Sample) | 3.0% | 4.9% |
| Standard Deviation (Population) | 2.9% | 4.9% |
Similar Demographics by Cognitive Disability
Demographics Similar to Colombians by Cognitive Disability
In terms of cognitive disability, the demographic groups most similar to Colombians are Venezuelan (16.6%, a difference of 0.010%), Argentinean (16.6%, a difference of 0.070%), Czechoslovakian (16.6%, a difference of 0.10%), Immigrants from Ukraine (16.6%, a difference of 0.12%), and Immigrants from England (16.6%, a difference of 0.13%).
| Demographics | Rating | Rank | Cognitive Disability |
| Pennsylvania Germans | 99.7 /100 | #58 | Exceptional 16.6% |
| Immigrants | Peru | 99.7 /100 | #59 | Exceptional 16.6% |
| Romanians | 99.7 /100 | #60 | Exceptional 16.6% |
| Immigrants | England | 99.6 /100 | #61 | Exceptional 16.6% |
| Czechoslovakians | 99.6 /100 | #62 | Exceptional 16.6% |
| Argentineans | 99.6 /100 | #63 | Exceptional 16.6% |
| Venezuelans | 99.6 /100 | #64 | Exceptional 16.6% |
| Colombians | 99.6 /100 | #65 | Exceptional 16.6% |
| Immigrants | Ukraine | 99.5 /100 | #66 | Exceptional 16.6% |
| Latvians | 99.5 /100 | #67 | Exceptional 16.6% |
| Ukrainians | 99.4 /100 | #68 | Exceptional 16.6% |
| Immigrants | Uzbekistan | 99.4 /100 | #69 | Exceptional 16.7% |
| Immigrants | Sweden | 99.4 /100 | #70 | Exceptional 16.7% |
| Immigrants | Belgium | 99.3 /100 | #71 | Exceptional 16.7% |
| Germans | 99.3 /100 | #72 | Exceptional 16.7% |
Demographics Similar to Slovaks by Cognitive Disability
In terms of cognitive disability, the demographic groups most similar to Slovaks are Greek (16.4%, a difference of 0.010%), Italian (16.4%, a difference of 0.080%), Russian (16.4%, a difference of 0.080%), Slovene (16.5%, a difference of 0.15%), and Immigrants from Israel (16.4%, a difference of 0.16%).
| Demographics | Rating | Rank | Cognitive Disability |
| Poles | 99.9 /100 | #28 | Exceptional 16.4% |
| Filipinos | 99.9 /100 | #29 | Exceptional 16.4% |
| Czechs | 99.9 /100 | #30 | Exceptional 16.4% |
| Immigrants | Romania | 99.9 /100 | #31 | Exceptional 16.4% |
| Immigrants | Israel | 99.9 /100 | #32 | Exceptional 16.4% |
| Italians | 99.9 /100 | #33 | Exceptional 16.4% |
| Russians | 99.9 /100 | #34 | Exceptional 16.4% |
| Slovaks | 99.9 /100 | #35 | Exceptional 16.4% |
| Greeks | 99.9 /100 | #36 | Exceptional 16.4% |
| Slovenes | 99.9 /100 | #37 | Exceptional 16.5% |
| Immigrants | Eastern Europe | 99.9 /100 | #38 | Exceptional 16.5% |
| Bolivians | 99.9 /100 | #39 | Exceptional 16.5% |
| Immigrants | Belarus | 99.9 /100 | #40 | Exceptional 16.5% |
| Cubans | 99.9 /100 | #41 | Exceptional 16.5% |
| Hungarians | 99.9 /100 | #42 | Exceptional 16.5% |