Colombian vs Immigrants from Spain Cognitive Disability
COMPARE
Colombian
Immigrants from Spain
Cognitive Disability
Cognitive Disability Comparison
Colombians
Immigrants from Spain
16.6%
COGNITIVE DISABILITY
99.6/ 100
METRIC RATING
65th/ 347
METRIC RANK
17.4%
COGNITIVE DISABILITY
27.7/ 100
METRIC RATING
190th/ 347
METRIC RANK
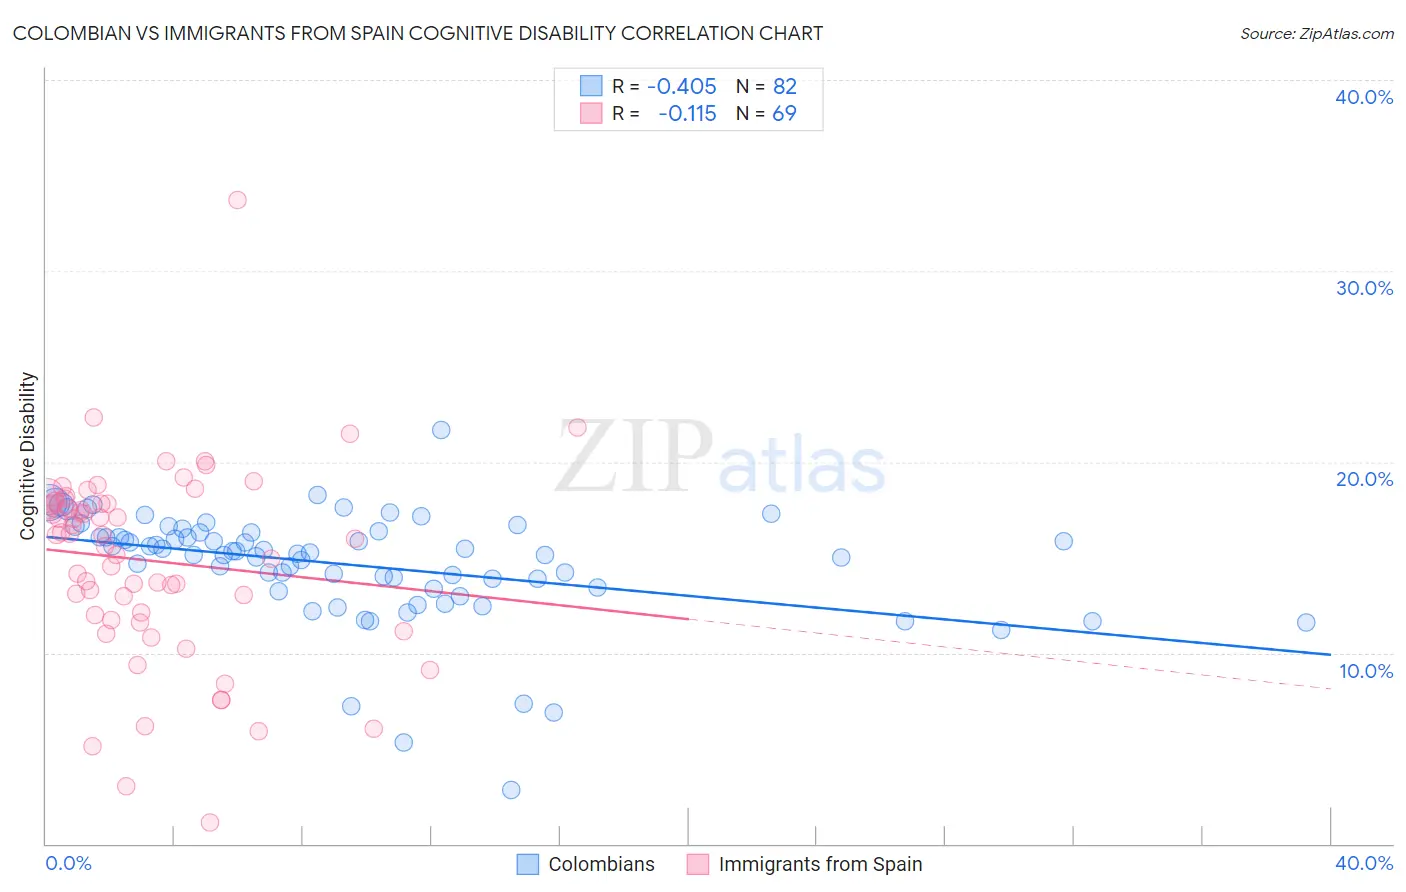
Colombian vs Immigrants from Spain Cognitive Disability Correlation Chart
The statistical analysis conducted on geographies consisting of 419,606,115 people shows a moderate negative correlation between the proportion of Colombians and percentage of population with cognitive disability in the United States with a correlation coefficient (R) of -0.405 and weighted average of 16.6%. Similarly, the statistical analysis conducted on geographies consisting of 239,684,126 people shows a poor negative correlation between the proportion of Immigrants from Spain and percentage of population with cognitive disability in the United States with a correlation coefficient (R) of -0.115 and weighted average of 17.4%, a difference of 4.7%.
Cognitive Disability Correlation Summary
| Measurement | Colombian | Immigrants from Spain |
| Minimum | 2.8% | 1.1% |
| Maximum | 21.7% | 33.7% |
| Range | 18.9% | 32.6% |
| Mean | 14.6% | 14.8% |
| Median | 15.3% | 16.2% |
| Interquartile 25% (IQ1) | 13.4% | 11.9% |
| Interquartile 75% (IQ3) | 16.3% | 17.9% |
| Interquartile Range (IQR) | 2.9% | 6.0% |
| Standard Deviation (Sample) | 3.0% | 5.2% |
| Standard Deviation (Population) | 2.9% | 5.1% |
Similar Demographics by Cognitive Disability
Demographics Similar to Colombians by Cognitive Disability
In terms of cognitive disability, the demographic groups most similar to Colombians are Venezuelan (16.6%, a difference of 0.010%), Argentinean (16.6%, a difference of 0.070%), Czechoslovakian (16.6%, a difference of 0.10%), Immigrants from Ukraine (16.6%, a difference of 0.12%), and Immigrants from England (16.6%, a difference of 0.13%).
| Demographics | Rating | Rank | Cognitive Disability |
| Pennsylvania Germans | 99.7 /100 | #58 | Exceptional 16.6% |
| Immigrants | Peru | 99.7 /100 | #59 | Exceptional 16.6% |
| Romanians | 99.7 /100 | #60 | Exceptional 16.6% |
| Immigrants | England | 99.6 /100 | #61 | Exceptional 16.6% |
| Czechoslovakians | 99.6 /100 | #62 | Exceptional 16.6% |
| Argentineans | 99.6 /100 | #63 | Exceptional 16.6% |
| Venezuelans | 99.6 /100 | #64 | Exceptional 16.6% |
| Colombians | 99.6 /100 | #65 | Exceptional 16.6% |
| Immigrants | Ukraine | 99.5 /100 | #66 | Exceptional 16.6% |
| Latvians | 99.5 /100 | #67 | Exceptional 16.6% |
| Ukrainians | 99.4 /100 | #68 | Exceptional 16.6% |
| Immigrants | Uzbekistan | 99.4 /100 | #69 | Exceptional 16.7% |
| Immigrants | Sweden | 99.4 /100 | #70 | Exceptional 16.7% |
| Immigrants | Belgium | 99.3 /100 | #71 | Exceptional 16.7% |
| Germans | 99.3 /100 | #72 | Exceptional 16.7% |
Demographics Similar to Immigrants from Spain by Cognitive Disability
In terms of cognitive disability, the demographic groups most similar to Immigrants from Spain are Nonimmigrants (17.4%, a difference of 0.010%), Immigrants from Haiti (17.4%, a difference of 0.020%), Immigrants from Western Asia (17.4%, a difference of 0.060%), Immigrants from France (17.4%, a difference of 0.070%), and Delaware (17.4%, a difference of 0.070%).
| Demographics | Rating | Rank | Cognitive Disability |
| Spaniards | 40.3 /100 | #183 | Average 17.3% |
| Crow | 39.1 /100 | #184 | Fair 17.3% |
| Afghans | 38.2 /100 | #185 | Fair 17.3% |
| Cambodians | 35.9 /100 | #186 | Fair 17.3% |
| Immigrants | Fiji | 33.7 /100 | #187 | Fair 17.4% |
| Immigrants | France | 29.8 /100 | #188 | Fair 17.4% |
| Immigrants | Western Asia | 29.5 /100 | #189 | Fair 17.4% |
| Immigrants | Spain | 27.7 /100 | #190 | Fair 17.4% |
| Immigrants | Nonimmigrants | 27.4 /100 | #191 | Fair 17.4% |
| Immigrants | Haiti | 27.1 /100 | #192 | Fair 17.4% |
| Delaware | 25.6 /100 | #193 | Fair 17.4% |
| Immigrants | Bosnia and Herzegovina | 22.0 /100 | #194 | Fair 17.4% |
| New Zealanders | 21.1 /100 | #195 | Fair 17.4% |
| Guyanese | 17.5 /100 | #196 | Poor 17.5% |
| Immigrants | Afghanistan | 16.7 /100 | #197 | Poor 17.5% |