Choctaw vs Soviet Union Disability Age 5 to 17
COMPARE
Choctaw
Soviet Union
Disability Age 5 to 17
Disability Age 5 to 17 Comparison
Choctaw
Soviet Union
6.9%
DISABILITY AGE 5 TO 17
0.0/ 100
METRIC RATING
339th/ 347
METRIC RANK
5.0%
DISABILITY AGE 5 TO 17
100.0/ 100
METRIC RATING
32nd/ 347
METRIC RANK
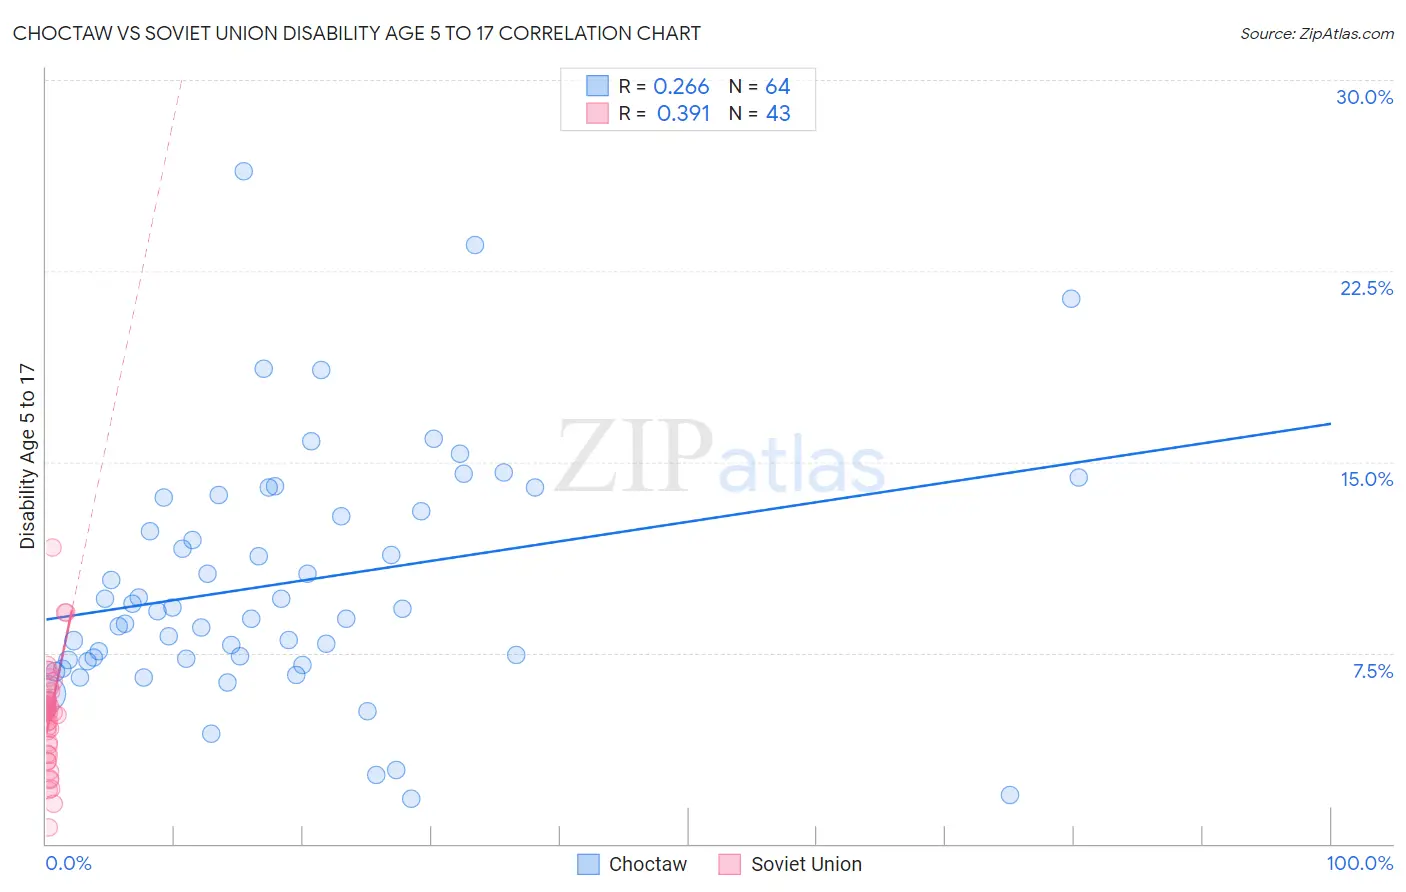
Choctaw vs Soviet Union Disability Age 5 to 17 Correlation Chart
The statistical analysis conducted on geographies consisting of 268,025,414 people shows a weak positive correlation between the proportion of Choctaw and percentage of population with a disability between the ages 5 and 17 in the United States with a correlation coefficient (R) of 0.266 and weighted average of 6.9%. Similarly, the statistical analysis conducted on geographies consisting of 43,434,016 people shows a mild positive correlation between the proportion of Soviet Union and percentage of population with a disability between the ages 5 and 17 in the United States with a correlation coefficient (R) of 0.391 and weighted average of 5.0%, a difference of 38.9%.
Disability Age 5 to 17 Correlation Summary
| Measurement | Choctaw | Soviet Union |
| Minimum | 1.8% | 0.64% |
| Maximum | 26.4% | 11.6% |
| Range | 24.6% | 11.0% |
| Mean | 10.3% | 5.0% |
| Median | 9.2% | 5.2% |
| Interquartile 25% (IQ1) | 7.2% | 3.6% |
| Interquartile 75% (IQ3) | 13.3% | 5.7% |
| Interquartile Range (IQR) | 6.1% | 2.1% |
| Standard Deviation (Sample) | 4.8% | 2.0% |
| Standard Deviation (Population) | 4.8% | 2.0% |
Similar Demographics by Disability Age 5 to 17
Demographics Similar to Choctaw by Disability Age 5 to 17
In terms of disability age 5 to 17, the demographic groups most similar to Choctaw are Cherokee (6.9%, a difference of 0.26%), Iroquois (6.9%, a difference of 0.33%), Creek (6.9%, a difference of 0.57%), Cape Verdean (7.0%, a difference of 0.80%), and Chickasaw (6.8%, a difference of 1.0%).
| Demographics | Rating | Rank | Disability Age 5 to 17 |
| Immigrants | Azores | 0.0 /100 | #332 | Tragic 6.7% |
| Blacks/African Americans | 0.0 /100 | #333 | Tragic 6.8% |
| Seminole | 0.0 /100 | #334 | Tragic 6.8% |
| Ottawa | 0.0 /100 | #335 | Tragic 6.8% |
| Chickasaw | 0.0 /100 | #336 | Tragic 6.8% |
| Creek | 0.0 /100 | #337 | Tragic 6.9% |
| Iroquois | 0.0 /100 | #338 | Tragic 6.9% |
| Choctaw | 0.0 /100 | #339 | Tragic 6.9% |
| Cherokee | 0.0 /100 | #340 | Tragic 6.9% |
| Cape Verdeans | 0.0 /100 | #341 | Tragic 7.0% |
| Chippewa | 0.0 /100 | #342 | Tragic 7.1% |
| Immigrants | Cabo Verde | 0.0 /100 | #343 | Tragic 7.1% |
| Cajuns | 0.0 /100 | #344 | Tragic 7.2% |
| Tsimshian | 0.0 /100 | #345 | Tragic 7.9% |
| Puerto Ricans | 0.0 /100 | #346 | Tragic 8.3% |
Demographics Similar to Soviet Union by Disability Age 5 to 17
In terms of disability age 5 to 17, the demographic groups most similar to Soviet Union are Immigrants from Pakistan (5.0%, a difference of 0.040%), Immigrants from Malaysia (5.0%, a difference of 0.28%), Immigrants from Indonesia (5.0%, a difference of 0.32%), Israeli (5.0%, a difference of 0.44%), and Immigrants from Serbia (4.9%, a difference of 0.51%).
| Demographics | Rating | Rank | Disability Age 5 to 17 |
| Immigrants | Asia | 100.0 /100 | #25 | Exceptional 4.8% |
| Bhutanese | 100.0 /100 | #26 | Exceptional 4.9% |
| Taiwanese | 100.0 /100 | #27 | Exceptional 4.9% |
| Immigrants | Japan | 100.0 /100 | #28 | Exceptional 4.9% |
| Immigrants | Serbia | 100.0 /100 | #29 | Exceptional 4.9% |
| Immigrants | Malaysia | 100.0 /100 | #30 | Exceptional 5.0% |
| Immigrants | Pakistan | 100.0 /100 | #31 | Exceptional 5.0% |
| Soviet Union | 100.0 /100 | #32 | Exceptional 5.0% |
| Immigrants | Indonesia | 100.0 /100 | #33 | Exceptional 5.0% |
| Israelis | 100.0 /100 | #34 | Exceptional 5.0% |
| Bolivians | 100.0 /100 | #35 | Exceptional 5.0% |
| Immigrants | Egypt | 100.0 /100 | #36 | Exceptional 5.0% |
| Immigrants | Belarus | 100.0 /100 | #37 | Exceptional 5.0% |
| Immigrants | Philippines | 100.0 /100 | #38 | Exceptional 5.0% |
| Immigrants | Argentina | 100.0 /100 | #39 | Exceptional 5.0% |