Alsatian vs Immigrants from Uruguay Female Disability
COMPARE
Alsatian
Immigrants from Uruguay
Female Disability
Female Disability Comparison
Alsatians
Immigrants from Uruguay
12.6%
FEMALE DISABILITY
2.5/ 100
METRIC RATING
244th/ 347
METRIC RANK
11.7%
FEMALE DISABILITY
98.5/ 100
METRIC RATING
100th/ 347
METRIC RANK
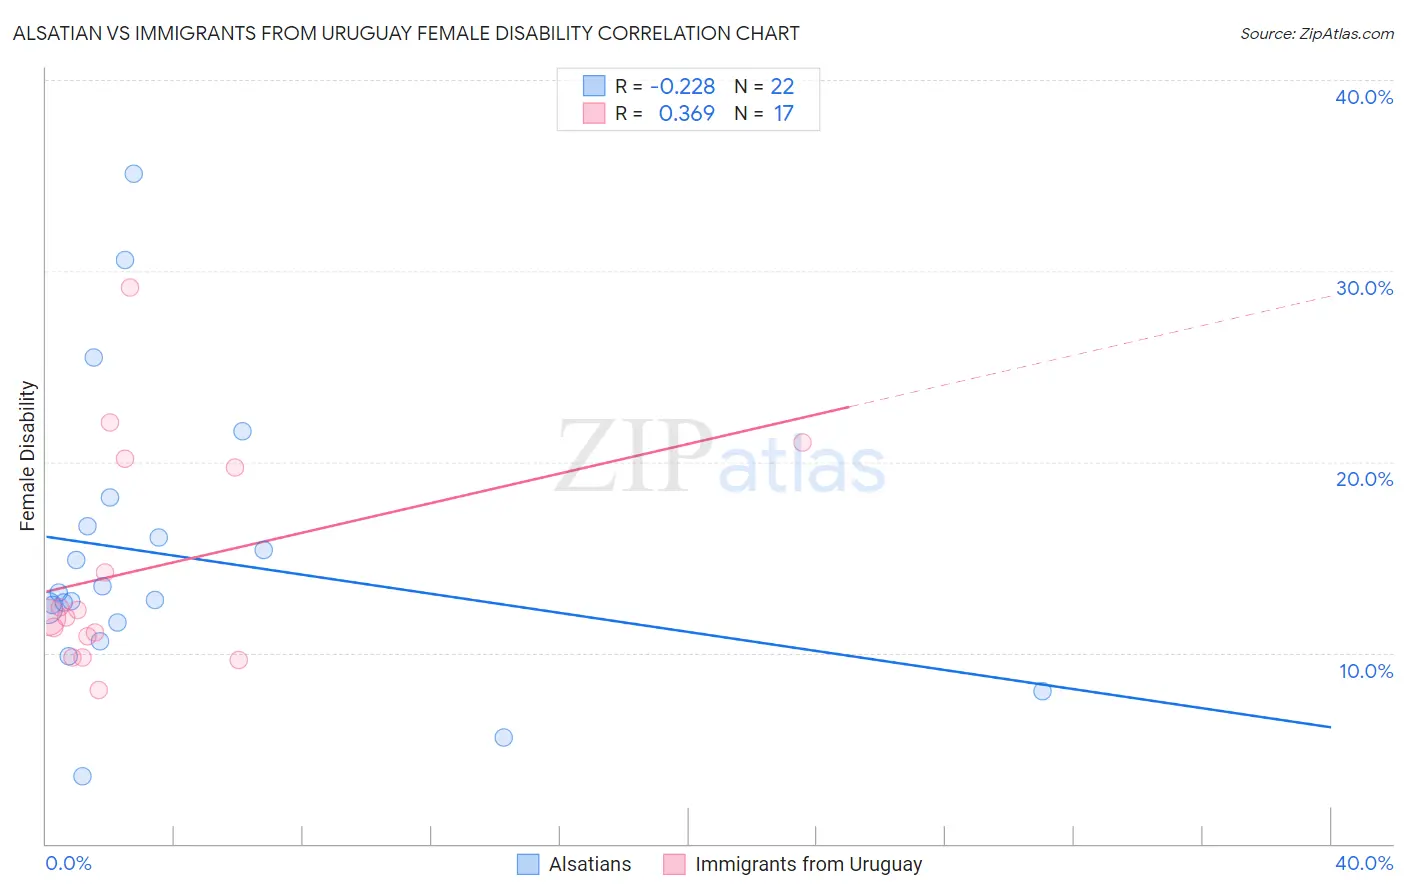
Alsatian vs Immigrants from Uruguay Female Disability Correlation Chart
The statistical analysis conducted on geographies consisting of 82,681,470 people shows a weak negative correlation between the proportion of Alsatians and percentage of females with a disability in the United States with a correlation coefficient (R) of -0.228 and weighted average of 12.6%. Similarly, the statistical analysis conducted on geographies consisting of 133,256,548 people shows a mild positive correlation between the proportion of Immigrants from Uruguay and percentage of females with a disability in the United States with a correlation coefficient (R) of 0.369 and weighted average of 11.7%, a difference of 7.7%.
Female Disability Correlation Summary
| Measurement | Alsatian | Immigrants from Uruguay |
| Minimum | 3.5% | 8.0% |
| Maximum | 35.1% | 29.1% |
| Range | 31.5% | 21.1% |
| Mean | 15.1% | 14.4% |
| Median | 13.0% | 11.9% |
| Interquartile 25% (IQ1) | 11.6% | 10.3% |
| Interquartile 75% (IQ3) | 16.6% | 19.9% |
| Interquartile Range (IQR) | 5.1% | 9.6% |
| Standard Deviation (Sample) | 7.5% | 5.8% |
| Standard Deviation (Population) | 7.3% | 5.6% |
Similar Demographics by Female Disability
Demographics Similar to Alsatians by Female Disability
In terms of female disability, the demographic groups most similar to Alsatians are Immigrants from Senegal (12.6%, a difference of 0.010%), Canadian (12.6%, a difference of 0.020%), Japanese (12.6%, a difference of 0.070%), Immigrants from Jamaica (12.6%, a difference of 0.14%), and Spanish American Indian (12.6%, a difference of 0.15%).
| Demographics | Rating | Rank | Female Disability |
| Slavs | 3.8 /100 | #237 | Tragic 12.6% |
| Yugoslavians | 3.7 /100 | #238 | Tragic 12.6% |
| Barbadians | 3.6 /100 | #239 | Tragic 12.6% |
| German Russians | 3.2 /100 | #240 | Tragic 12.6% |
| Japanese | 2.7 /100 | #241 | Tragic 12.6% |
| Canadians | 2.6 /100 | #242 | Tragic 12.6% |
| Immigrants | Senegal | 2.5 /100 | #243 | Tragic 12.6% |
| Alsatians | 2.5 /100 | #244 | Tragic 12.6% |
| Immigrants | Jamaica | 2.2 /100 | #245 | Tragic 12.6% |
| Spanish American Indians | 2.1 /100 | #246 | Tragic 12.6% |
| Menominee | 2.1 /100 | #247 | Tragic 12.6% |
| Carpatho Rusyns | 2.0 /100 | #248 | Tragic 12.6% |
| Immigrants | Congo | 1.8 /100 | #249 | Tragic 12.7% |
| Slovenes | 1.7 /100 | #250 | Tragic 12.7% |
| Crow | 1.6 /100 | #251 | Tragic 12.7% |
Demographics Similar to Immigrants from Uruguay by Female Disability
In terms of female disability, the demographic groups most similar to Immigrants from Uruguay are Immigrants from Costa Rica (11.7%, a difference of 0.020%), Immigrants from South Eastern Asia (11.7%, a difference of 0.030%), Immigrants from Philippines (11.7%, a difference of 0.050%), Immigrants from Eastern Africa (11.7%, a difference of 0.10%), and Immigrants from Western Asia (11.7%, a difference of 0.11%).
| Demographics | Rating | Rank | Female Disability |
| Immigrants | Sierra Leone | 99.4 /100 | #93 | Exceptional 11.6% |
| Immigrants | Brazil | 99.4 /100 | #94 | Exceptional 11.6% |
| Immigrants | Northern Europe | 99.4 /100 | #95 | Exceptional 11.6% |
| Immigrants | Russia | 99.0 /100 | #96 | Exceptional 11.7% |
| Koreans | 99.0 /100 | #97 | Exceptional 11.7% |
| Uruguayans | 98.8 /100 | #98 | Exceptional 11.7% |
| Immigrants | Philippines | 98.6 /100 | #99 | Exceptional 11.7% |
| Immigrants | Uruguay | 98.5 /100 | #100 | Exceptional 11.7% |
| Immigrants | Costa Rica | 98.4 /100 | #101 | Exceptional 11.7% |
| Immigrants | South Eastern Asia | 98.4 /100 | #102 | Exceptional 11.7% |
| Immigrants | Eastern Africa | 98.3 /100 | #103 | Exceptional 11.7% |
| Immigrants | Western Asia | 98.3 /100 | #104 | Exceptional 11.7% |
| Australians | 98.3 /100 | #105 | Exceptional 11.7% |
| Immigrants | Greece | 98.2 /100 | #106 | Exceptional 11.7% |
| Latvians | 98.2 /100 | #107 | Exceptional 11.7% |