Chippewa vs Immigrants from Armenia Vision Disability
COMPARE
Chippewa
Immigrants from Armenia
Vision Disability
Vision Disability Comparison
Chippewa
Immigrants from Armenia
2.4%
VISION DISABILITY
0.0/ 100
METRIC RATING
275th/ 347
METRIC RANK
2.1%
VISION DISABILITY
93.8/ 100
METRIC RATING
110th/ 347
METRIC RANK
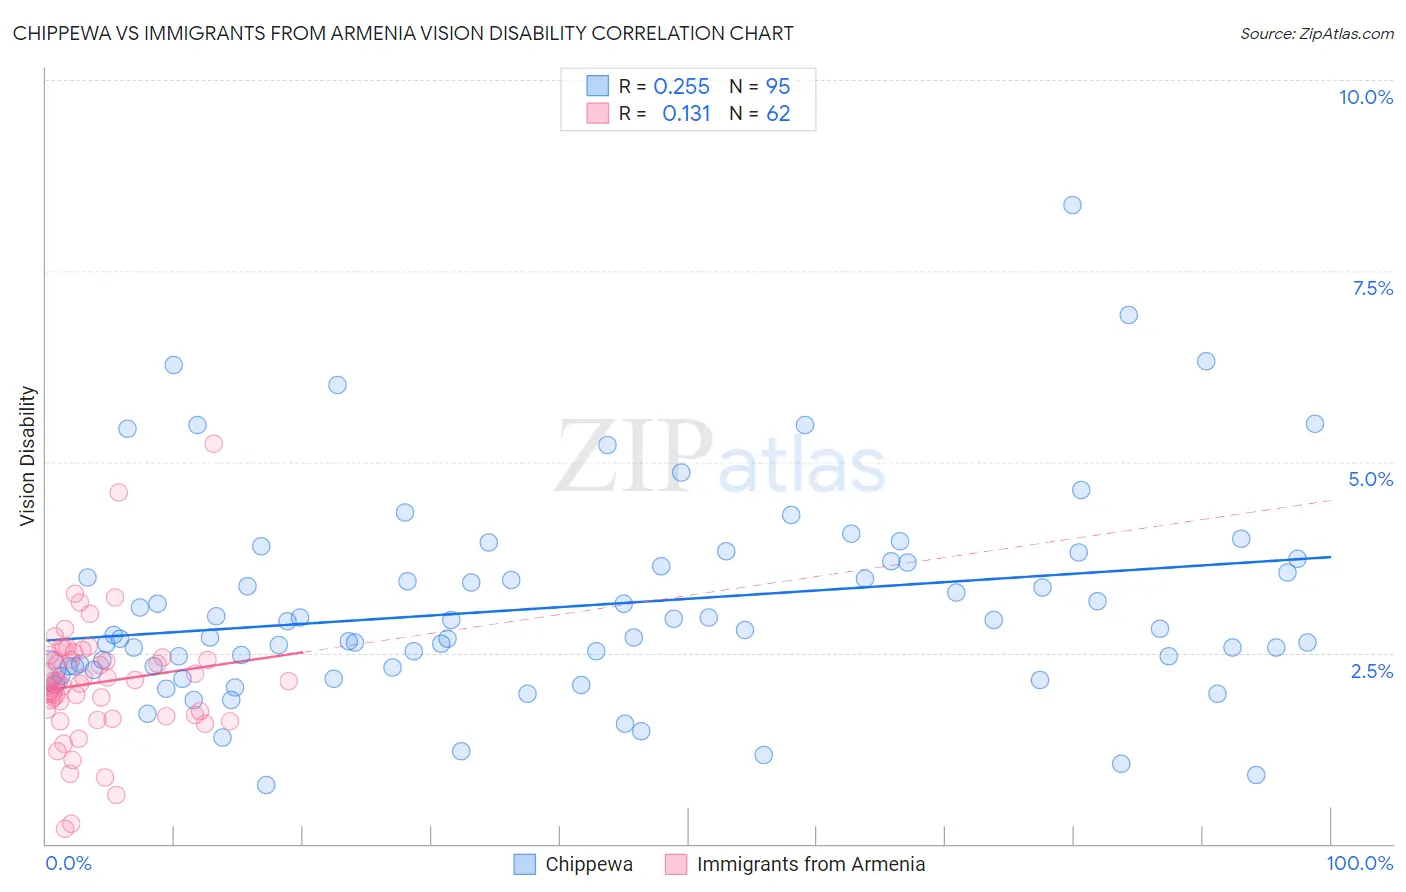
Chippewa vs Immigrants from Armenia Vision Disability Correlation Chart
The statistical analysis conducted on geographies consisting of 214,949,512 people shows a weak positive correlation between the proportion of Chippewa and percentage of population with vision disability in the United States with a correlation coefficient (R) of 0.255 and weighted average of 2.4%. Similarly, the statistical analysis conducted on geographies consisting of 97,705,709 people shows a poor positive correlation between the proportion of Immigrants from Armenia and percentage of population with vision disability in the United States with a correlation coefficient (R) of 0.131 and weighted average of 2.1%, a difference of 17.5%.
Vision Disability Correlation Summary
| Measurement | Chippewa | Immigrants from Armenia |
| Minimum | 0.77% | 0.20% |
| Maximum | 8.4% | 5.2% |
| Range | 7.6% | 5.0% |
| Mean | 3.1% | 2.1% |
| Median | 2.7% | 2.1% |
| Interquartile 25% (IQ1) | 2.3% | 1.7% |
| Interquartile 75% (IQ3) | 3.7% | 2.4% |
| Interquartile Range (IQR) | 1.4% | 0.76% |
| Standard Deviation (Sample) | 1.3% | 0.82% |
| Standard Deviation (Population) | 1.3% | 0.81% |
Similar Demographics by Vision Disability
Demographics Similar to Chippewa by Vision Disability
In terms of vision disability, the demographic groups most similar to Chippewa are Scotch-Irish (2.4%, a difference of 0.090%), Bahamian (2.4%, a difference of 0.13%), Spanish (2.4%, a difference of 0.29%), Nepalese (2.4%, a difference of 0.30%), and Immigrants from Latin America (2.4%, a difference of 0.32%).
| Demographics | Rating | Rank | Vision Disability |
| Senegalese | 0.1 /100 | #268 | Tragic 2.4% |
| Celtics | 0.1 /100 | #269 | Tragic 2.4% |
| Cubans | 0.1 /100 | #270 | Tragic 2.4% |
| Immigrants | Azores | 0.1 /100 | #271 | Tragic 2.4% |
| Spaniards | 0.1 /100 | #272 | Tragic 2.4% |
| Immigrants | Bahamas | 0.1 /100 | #273 | Tragic 2.4% |
| Immigrants | Latin America | 0.0 /100 | #274 | Tragic 2.4% |
| Chippewa | 0.0 /100 | #275 | Tragic 2.4% |
| Scotch-Irish | 0.0 /100 | #276 | Tragic 2.4% |
| Bahamians | 0.0 /100 | #277 | Tragic 2.4% |
| Spanish | 0.0 /100 | #278 | Tragic 2.4% |
| Nepalese | 0.0 /100 | #279 | Tragic 2.4% |
| Cape Verdeans | 0.0 /100 | #280 | Tragic 2.4% |
| U.S. Virgin Islanders | 0.0 /100 | #281 | Tragic 2.5% |
| Immigrants | Caribbean | 0.0 /100 | #282 | Tragic 2.5% |
Demographics Similar to Immigrants from Armenia by Vision Disability
In terms of vision disability, the demographic groups most similar to Immigrants from Armenia are Peruvian (2.1%, a difference of 0.060%), Chilean (2.1%, a difference of 0.070%), Korean (2.1%, a difference of 0.090%), Swedish (2.1%, a difference of 0.12%), and Danish (2.1%, a difference of 0.12%).
| Demographics | Rating | Rank | Vision Disability |
| Immigrants | Austria | 94.4 /100 | #103 | Exceptional 2.1% |
| Immigrants | Italy | 94.4 /100 | #104 | Exceptional 2.1% |
| Carpatho Rusyns | 94.3 /100 | #105 | Exceptional 2.1% |
| Swedes | 94.2 /100 | #106 | Exceptional 2.1% |
| Danes | 94.2 /100 | #107 | Exceptional 2.1% |
| Koreans | 94.1 /100 | #108 | Exceptional 2.1% |
| Chileans | 94.0 /100 | #109 | Exceptional 2.1% |
| Immigrants | Armenia | 93.8 /100 | #110 | Exceptional 2.1% |
| Peruvians | 93.5 /100 | #111 | Exceptional 2.1% |
| Immigrants | Denmark | 92.9 /100 | #112 | Exceptional 2.1% |
| Kenyans | 92.5 /100 | #113 | Exceptional 2.1% |
| Croatians | 92.3 /100 | #114 | Exceptional 2.1% |
| Immigrants | Vietnam | 92.2 /100 | #115 | Exceptional 2.1% |
| Ugandans | 92.2 /100 | #116 | Exceptional 2.1% |
| Poles | 92.0 /100 | #117 | Exceptional 2.1% |