Chippewa vs Spanish American Disability Age Under 5
COMPARE
Chippewa
Spanish American
Disability Age Under 5
Disability Age Under 5 Comparison
Chippewa
Spanish Americans
1.9%
DISABILITY AGE UNDER 5
0.0/ 100
METRIC RATING
332nd/ 347
METRIC RANK
1.1%
DISABILITY AGE UNDER 5
96.9/ 100
METRIC RATING
93rd/ 347
METRIC RANK
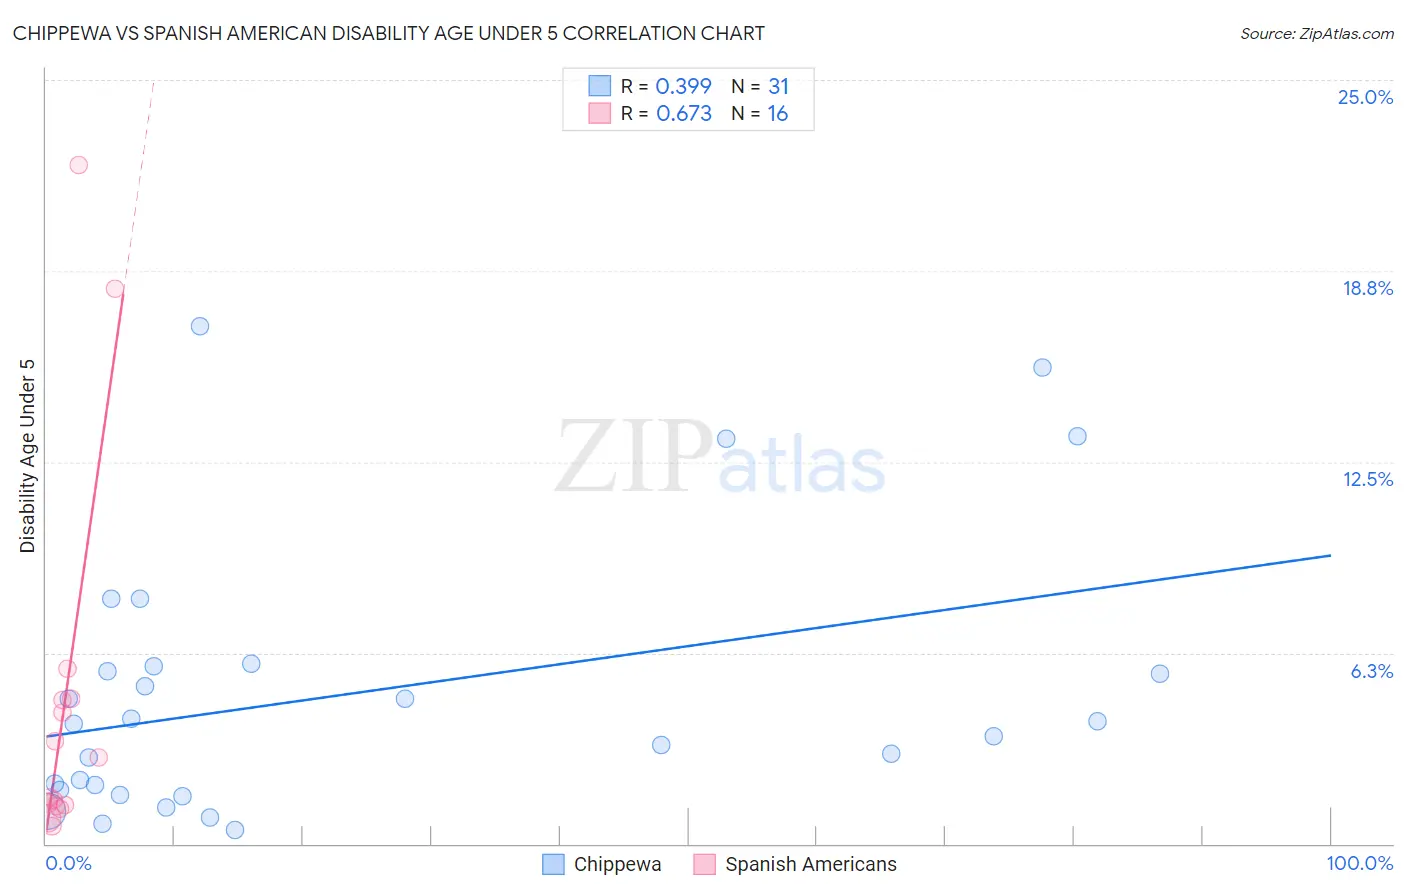
Chippewa vs Spanish American Disability Age Under 5 Correlation Chart
The statistical analysis conducted on geographies consisting of 140,016,256 people shows a mild positive correlation between the proportion of Chippewa and percentage of population with a disability under the age of 5 in the United States with a correlation coefficient (R) of 0.399 and weighted average of 1.9%. Similarly, the statistical analysis conducted on geographies consisting of 83,596,230 people shows a significant positive correlation between the proportion of Spanish Americans and percentage of population with a disability under the age of 5 in the United States with a correlation coefficient (R) of 0.673 and weighted average of 1.1%, a difference of 64.4%.
Disability Age Under 5 Correlation Summary
| Measurement | Chippewa | Spanish American |
| Minimum | 0.43% | 0.56% |
| Maximum | 16.9% | 22.2% |
| Range | 16.5% | 21.7% |
| Mean | 4.9% | 4.7% |
| Median | 3.9% | 2.2% |
| Interquartile 25% (IQ1) | 1.8% | 1.3% |
| Interquartile 75% (IQ3) | 5.8% | 4.7% |
| Interquartile Range (IQR) | 4.0% | 3.5% |
| Standard Deviation (Sample) | 4.4% | 6.3% |
| Standard Deviation (Population) | 4.3% | 6.1% |
Similar Demographics by Disability Age Under 5
Demographics Similar to Chippewa by Disability Age Under 5
In terms of disability age under 5, the demographic groups most similar to Chippewa are French Canadian (1.9%, a difference of 0.060%), Choctaw (1.9%, a difference of 0.36%), Houma (1.9%, a difference of 0.69%), American (1.9%, a difference of 1.2%), and Osage (1.8%, a difference of 2.9%).
| Demographics | Rating | Rank | Disability Age Under 5 |
| Immigrants | Portugal | 0.0 /100 | #325 | Tragic 1.8% |
| Sioux | 0.0 /100 | #326 | Tragic 1.8% |
| Osage | 0.0 /100 | #327 | Tragic 1.8% |
| Americans | 0.0 /100 | #328 | Tragic 1.9% |
| Houma | 0.0 /100 | #329 | Tragic 1.9% |
| Choctaw | 0.0 /100 | #330 | Tragic 1.9% |
| French Canadians | 0.0 /100 | #331 | Tragic 1.9% |
| Chippewa | 0.0 /100 | #332 | Tragic 1.9% |
| Dutch West Indians | 0.0 /100 | #333 | Tragic 1.9% |
| Natives/Alaskans | 0.0 /100 | #334 | Tragic 1.9% |
| Pennsylvania Germans | 0.0 /100 | #335 | Tragic 1.9% |
| Paraguayans | 0.0 /100 | #336 | Tragic 2.0% |
| Apache | 0.0 /100 | #337 | Tragic 2.0% |
| Tohono O'odham | 0.0 /100 | #338 | Tragic 2.2% |
| Immigrants | Azores | 0.0 /100 | #339 | Tragic 2.2% |
Demographics Similar to Spanish Americans by Disability Age Under 5
In terms of disability age under 5, the demographic groups most similar to Spanish Americans are Immigrants from Cuba (1.1%, a difference of 0.030%), Sri Lankan (1.1%, a difference of 0.060%), Immigrants from Moldova (1.1%, a difference of 0.11%), Albanian (1.1%, a difference of 0.20%), and Mongolian (1.1%, a difference of 0.22%).
| Demographics | Rating | Rank | Disability Age Under 5 |
| Okinawans | 97.6 /100 | #86 | Exceptional 1.1% |
| Ugandans | 97.5 /100 | #87 | Exceptional 1.1% |
| Immigrants | Dominican Republic | 97.5 /100 | #88 | Exceptional 1.1% |
| Ethiopians | 97.2 /100 | #89 | Exceptional 1.1% |
| Chinese | 97.2 /100 | #90 | Exceptional 1.1% |
| Albanians | 97.2 /100 | #91 | Exceptional 1.1% |
| Immigrants | Cuba | 97.0 /100 | #92 | Exceptional 1.1% |
| Spanish Americans | 96.9 /100 | #93 | Exceptional 1.1% |
| Sri Lankans | 96.8 /100 | #94 | Exceptional 1.1% |
| Immigrants | Moldova | 96.8 /100 | #95 | Exceptional 1.1% |
| Mongolians | 96.6 /100 | #96 | Exceptional 1.1% |
| Immigrants | Iraq | 96.5 /100 | #97 | Exceptional 1.1% |
| Immigrants | South Eastern Asia | 96.5 /100 | #98 | Exceptional 1.1% |
| Dominicans | 96.3 /100 | #99 | Exceptional 1.1% |
| Nicaraguans | 96.3 /100 | #100 | Exceptional 1.1% |