Chippewa vs Cuban Householder Income Ages 25 - 44 years
COMPARE
Chippewa
Cuban
Householder Income Ages 25 - 44 years
Householder Income Ages 25 - 44 years Comparison
Chippewa
Cubans
$80,005
HOUSEHOLDER INCOME AGES 25 - 44 YEARS
0.0/ 100
METRIC RATING
309th/ 347
METRIC RANK
$81,483
HOUSEHOLDER INCOME AGES 25 - 44 YEARS
0.1/ 100
METRIC RATING
294th/ 347
METRIC RANK
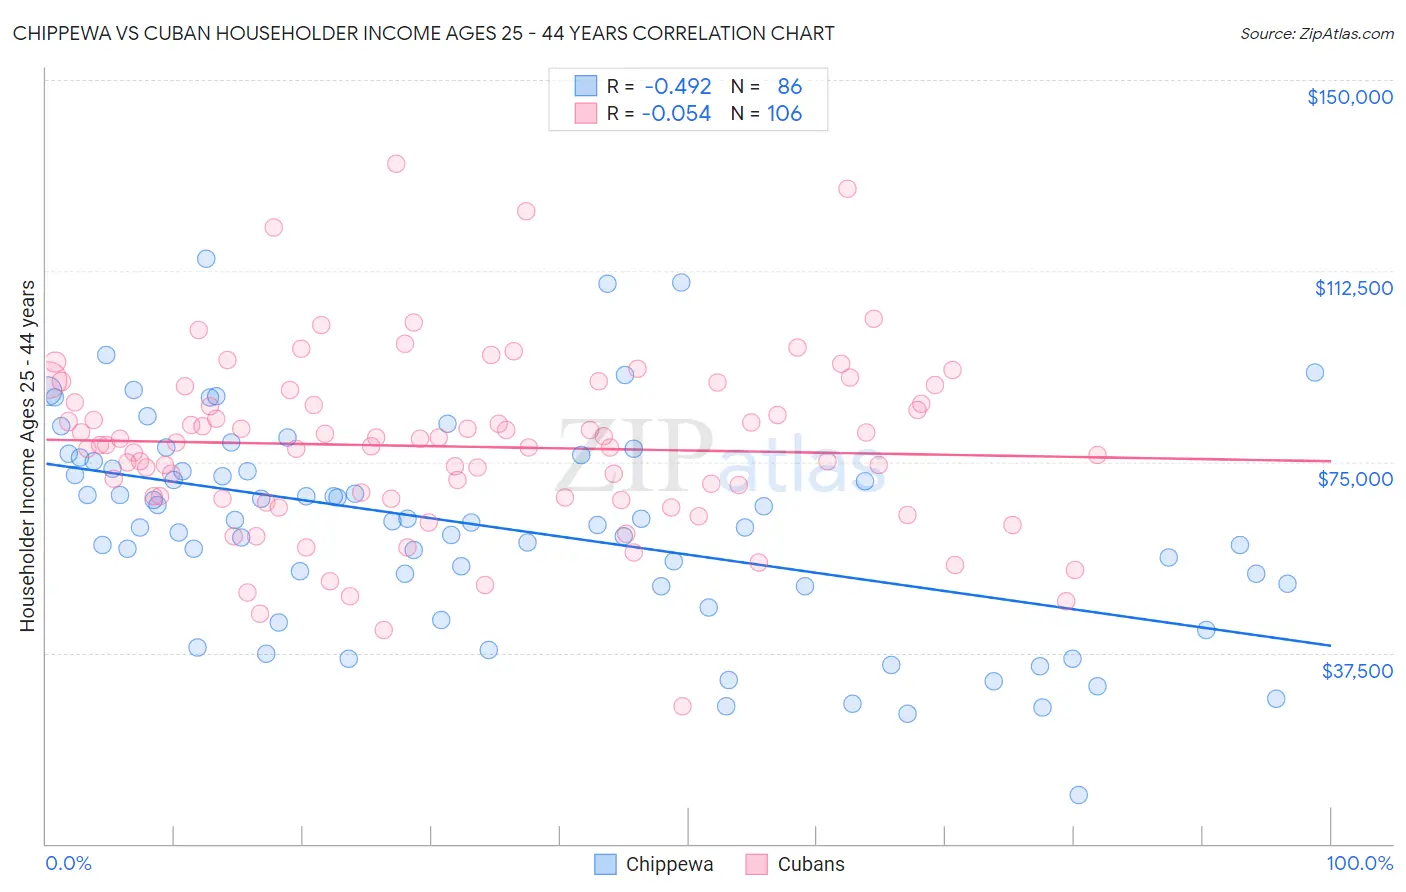
Chippewa vs Cuban Householder Income Ages 25 - 44 years Correlation Chart
The statistical analysis conducted on geographies consisting of 214,656,590 people shows a moderate negative correlation between the proportion of Chippewa and household income with householder between the ages 25 and 44 in the United States with a correlation coefficient (R) of -0.492 and weighted average of $80,005. Similarly, the statistical analysis conducted on geographies consisting of 447,656,503 people shows a slight negative correlation between the proportion of Cubans and household income with householder between the ages 25 and 44 in the United States with a correlation coefficient (R) of -0.054 and weighted average of $81,483, a difference of 1.8%.
Householder Income Ages 25 - 44 years Correlation Summary
| Measurement | Chippewa | Cuban |
| Minimum | $9,500 | $27,125 |
| Maximum | $114,792 | $133,668 |
| Range | $105,292 | $106,543 |
| Mean | $62,281 | $78,016 |
| Median | $63,204 | $78,321 |
| Interquartile 25% (IQ1) | $50,634 | $67,806 |
| Interquartile 75% (IQ3) | $75,056 | $86,783 |
| Interquartile Range (IQR) | $24,422 | $18,977 |
| Standard Deviation (Sample) | $20,701 | $17,466 |
| Standard Deviation (Population) | $20,580 | $17,384 |
Demographics Similar to Chippewa and Cubans by Householder Income Ages 25 - 44 years
In terms of householder income ages 25 - 44 years, the demographic groups most similar to Chippewa are Immigrants from Central America ($80,012, a difference of 0.010%), Haitian ($80,055, a difference of 0.060%), Fijian ($79,956, a difference of 0.060%), Apache ($80,260, a difference of 0.32%), and Immigrants from Dominican Republic ($80,319, a difference of 0.39%). Similarly, the demographic groups most similar to Cubans are Blackfeet ($81,531, a difference of 0.060%), Bangladeshi ($81,363, a difference of 0.15%), Immigrants from Dominica ($81,351, a difference of 0.16%), Immigrants from Guatemala ($81,341, a difference of 0.17%), and Yaqui ($81,656, a difference of 0.21%).
| Demographics | Rating | Rank | Householder Income Ages 25 - 44 years |
| Potawatomi | 0.1 /100 | #291 | Tragic $81,774 |
| Yaqui | 0.1 /100 | #292 | Tragic $81,656 |
| Blackfeet | 0.1 /100 | #293 | Tragic $81,531 |
| Cubans | 0.1 /100 | #294 | Tragic $81,483 |
| Bangladeshis | 0.1 /100 | #295 | Tragic $81,363 |
| Immigrants | Dominica | 0.1 /100 | #296 | Tragic $81,351 |
| Immigrants | Guatemala | 0.1 /100 | #297 | Tragic $81,341 |
| Dominicans | 0.1 /100 | #298 | Tragic $81,229 |
| Immigrants | Liberia | 0.1 /100 | #299 | Tragic $80,863 |
| Cherokee | 0.0 /100 | #300 | Tragic $80,843 |
| Immigrants | Micronesia | 0.0 /100 | #301 | Tragic $80,544 |
| Hispanics or Latinos | 0.0 /100 | #302 | Tragic $80,515 |
| Mexicans | 0.0 /100 | #303 | Tragic $80,427 |
| Immigrants | Caribbean | 0.0 /100 | #304 | Tragic $80,326 |
| Immigrants | Dominican Republic | 0.0 /100 | #305 | Tragic $80,319 |
| Apache | 0.0 /100 | #306 | Tragic $80,260 |
| Haitians | 0.0 /100 | #307 | Tragic $80,055 |
| Immigrants | Central America | 0.0 /100 | #308 | Tragic $80,012 |
| Chippewa | 0.0 /100 | #309 | Tragic $80,005 |
| Fijians | 0.0 /100 | #310 | Tragic $79,956 |
| Indonesians | 0.0 /100 | #311 | Tragic $79,543 |