Chilean vs Maltese Self-Care Disability
COMPARE
Chilean
Maltese
Self-Care Disability
Self-Care Disability Comparison
Chileans
Maltese
2.3%
SELF-CARE DISABILITY
98.8/ 100
METRIC RATING
80th/ 347
METRIC RANK
2.5%
SELF-CARE DISABILITY
37.5/ 100
METRIC RATING
182nd/ 347
METRIC RANK
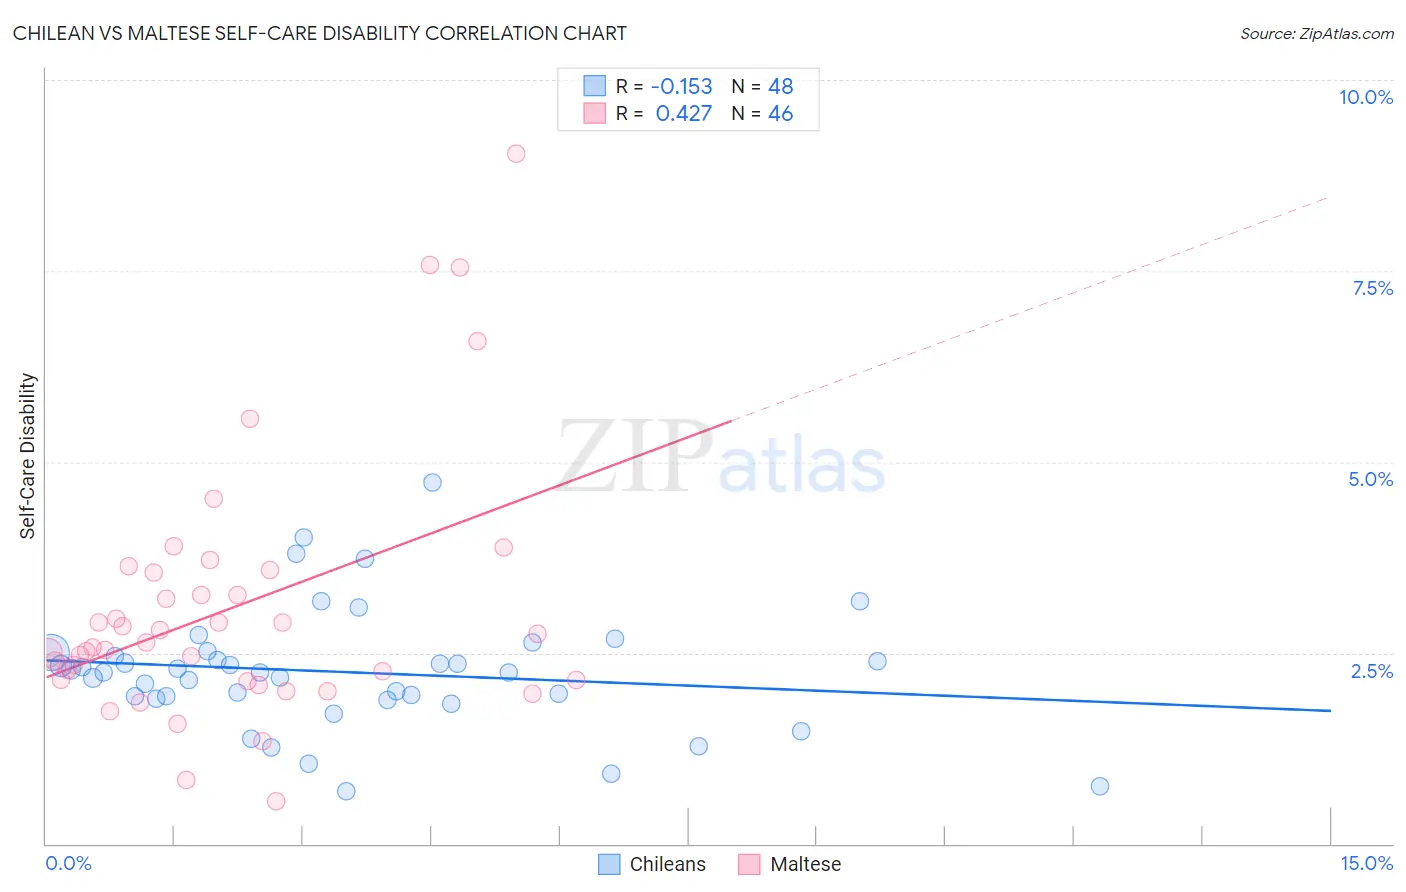
Chilean vs Maltese Self-Care Disability Correlation Chart
The statistical analysis conducted on geographies consisting of 256,527,062 people shows a poor negative correlation between the proportion of Chileans and percentage of population with self-care disability in the United States with a correlation coefficient (R) of -0.153 and weighted average of 2.3%. Similarly, the statistical analysis conducted on geographies consisting of 126,446,361 people shows a moderate positive correlation between the proportion of Maltese and percentage of population with self-care disability in the United States with a correlation coefficient (R) of 0.427 and weighted average of 2.5%, a difference of 6.2%.
Self-Care Disability Correlation Summary
| Measurement | Chilean | Maltese |
| Minimum | 0.69% | 0.56% |
| Maximum | 4.7% | 9.0% |
| Range | 4.0% | 8.5% |
| Mean | 2.2% | 3.1% |
| Median | 2.2% | 2.6% |
| Interquartile 25% (IQ1) | 1.9% | 2.1% |
| Interquartile 75% (IQ3) | 2.5% | 3.5% |
| Interquartile Range (IQR) | 0.57% | 1.4% |
| Standard Deviation (Sample) | 0.79% | 1.7% |
| Standard Deviation (Population) | 0.78% | 1.7% |
Similar Demographics by Self-Care Disability
Demographics Similar to Chileans by Self-Care Disability
In terms of self-care disability, the demographic groups most similar to Chileans are Ugandan (2.3%, a difference of 0.070%), Immigrants from Denmark (2.3%, a difference of 0.070%), Indian (Asian) (2.3%, a difference of 0.14%), Immigrants from Spain (2.3%, a difference of 0.17%), and Immigrants from Middle Africa (2.3%, a difference of 0.19%).
| Demographics | Rating | Rank | Self-Care Disability |
| Immigrants | Egypt | 99.1 /100 | #73 | Exceptional 2.3% |
| Immigrants | Switzerland | 99.1 /100 | #74 | Exceptional 2.3% |
| Immigrants | Netherlands | 99.1 /100 | #75 | Exceptional 2.3% |
| Immigrants | China | 99.1 /100 | #76 | Exceptional 2.3% |
| Immigrants | Middle Africa | 99.0 /100 | #77 | Exceptional 2.3% |
| Immigrants | Ireland | 99.0 /100 | #78 | Exceptional 2.3% |
| Immigrants | Kenya | 99.0 /100 | #79 | Exceptional 2.3% |
| Chileans | 98.8 /100 | #80 | Exceptional 2.3% |
| Ugandans | 98.8 /100 | #81 | Exceptional 2.3% |
| Immigrants | Denmark | 98.8 /100 | #82 | Exceptional 2.3% |
| Indians (Asian) | 98.7 /100 | #83 | Exceptional 2.3% |
| Immigrants | Spain | 98.7 /100 | #84 | Exceptional 2.3% |
| Estonians | 98.3 /100 | #85 | Exceptional 2.3% |
| Immigrants | Northern Africa | 98.2 /100 | #86 | Exceptional 2.3% |
| Sierra Leoneans | 98.0 /100 | #87 | Exceptional 2.4% |
Demographics Similar to Maltese by Self-Care Disability
In terms of self-care disability, the demographic groups most similar to Maltese are Salvadoran (2.5%, a difference of 0.050%), Yugoslavian (2.5%, a difference of 0.070%), Ghanaian (2.5%, a difference of 0.14%), Slavic (2.5%, a difference of 0.16%), and Indonesian (2.5%, a difference of 0.19%).
| Demographics | Rating | Rank | Self-Care Disability |
| Immigrants | Bosnia and Herzegovina | 49.6 /100 | #175 | Average 2.5% |
| Immigrants | Afghanistan | 47.6 /100 | #176 | Average 2.5% |
| Immigrants | Kazakhstan | 46.7 /100 | #177 | Average 2.5% |
| English | 46.2 /100 | #178 | Average 2.5% |
| Hungarians | 45.5 /100 | #179 | Average 2.5% |
| Indonesians | 41.2 /100 | #180 | Average 2.5% |
| Ghanaians | 40.4 /100 | #181 | Average 2.5% |
| Maltese | 37.5 /100 | #182 | Fair 2.5% |
| Salvadorans | 36.4 /100 | #183 | Fair 2.5% |
| Yugoslavians | 36.1 /100 | #184 | Fair 2.5% |
| Slavs | 34.3 /100 | #185 | Fair 2.5% |
| Immigrants | El Salvador | 33.0 /100 | #186 | Fair 2.5% |
| Irish | 28.7 /100 | #187 | Fair 2.5% |
| Immigrants | Oceania | 28.3 /100 | #188 | Fair 2.5% |
| Immigrants | Eastern Europe | 28.0 /100 | #189 | Fair 2.5% |