Cheyenne vs Okinawan Disability Age Over 75
COMPARE
Cheyenne
Okinawan
Disability Age Over 75
Disability Age Over 75 Comparison
Cheyenne
Okinawans
50.9%
DISABILITY AGE OVER 75
0.0/ 100
METRIC RATING
312th/ 347
METRIC RANK
44.9%
DISABILITY AGE OVER 75
100.0/ 100
METRIC RATING
7th/ 347
METRIC RANK
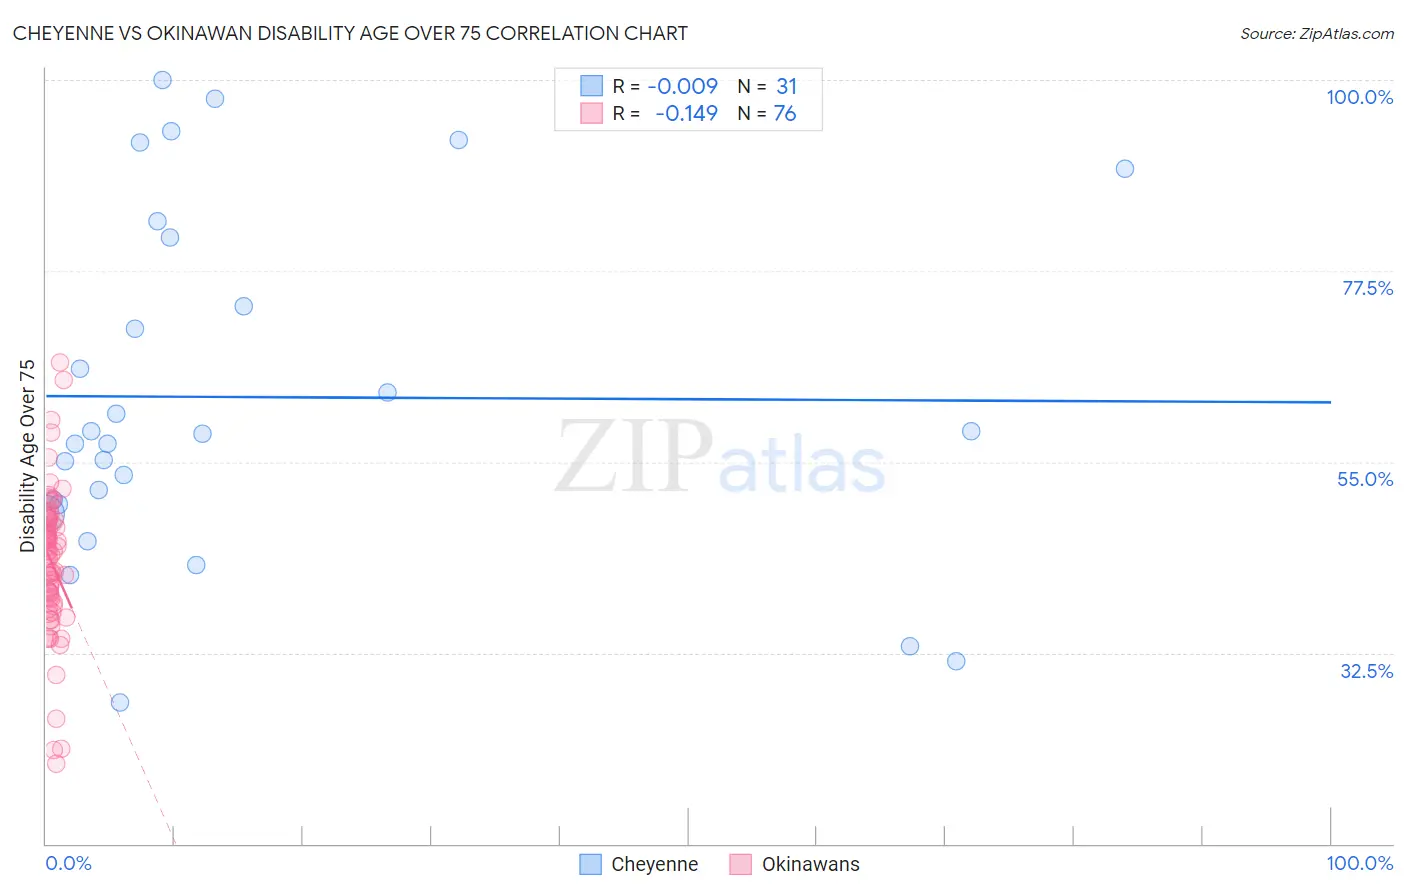
Cheyenne vs Okinawan Disability Age Over 75 Correlation Chart
The statistical analysis conducted on geographies consisting of 80,679,697 people shows no correlation between the proportion of Cheyenne and percentage of population with a disability over the age of 75 in the United States with a correlation coefficient (R) of -0.009 and weighted average of 50.9%. Similarly, the statistical analysis conducted on geographies consisting of 73,696,171 people shows a poor negative correlation between the proportion of Okinawans and percentage of population with a disability over the age of 75 in the United States with a correlation coefficient (R) of -0.149 and weighted average of 44.9%, a difference of 13.4%.
Disability Age Over 75 Correlation Summary
| Measurement | Cheyenne | Okinawan |
| Minimum | 26.7% | 19.4% |
| Maximum | 100.0% | 66.7% |
| Range | 73.3% | 47.2% |
| Mean | 62.6% | 43.2% |
| Median | 58.3% | 44.2% |
| Interquartile 25% (IQ1) | 50.0% | 38.6% |
| Interquartile 75% (IQ3) | 81.5% | 48.1% |
| Interquartile Range (IQR) | 31.5% | 9.5% |
| Standard Deviation (Sample) | 20.2% | 8.5% |
| Standard Deviation (Population) | 19.9% | 8.5% |
Similar Demographics by Disability Age Over 75
Demographics Similar to Cheyenne by Disability Age Over 75
In terms of disability age over 75, the demographic groups most similar to Cheyenne are Immigrants from the Azores (50.9%, a difference of 0.050%), Immigrants from Mexico (51.1%, a difference of 0.42%), Cajun (50.7%, a difference of 0.45%), Mexican (51.1%, a difference of 0.47%), and Tlingit-Haida (50.6%, a difference of 0.55%).
| Demographics | Rating | Rank | Disability Age Over 75 |
| Central American Indians | 0.0 /100 | #305 | Tragic 50.5% |
| Immigrants | Central America | 0.0 /100 | #306 | Tragic 50.5% |
| Immigrants | Fiji | 0.0 /100 | #307 | Tragic 50.6% |
| Hispanics or Latinos | 0.0 /100 | #308 | Tragic 50.6% |
| Aleuts | 0.0 /100 | #309 | Tragic 50.6% |
| Tlingit-Haida | 0.0 /100 | #310 | Tragic 50.6% |
| Cajuns | 0.0 /100 | #311 | Tragic 50.7% |
| Cheyenne | 0.0 /100 | #312 | Tragic 50.9% |
| Immigrants | Azores | 0.0 /100 | #313 | Tragic 50.9% |
| Immigrants | Mexico | 0.0 /100 | #314 | Tragic 51.1% |
| Mexicans | 0.0 /100 | #315 | Tragic 51.1% |
| Chickasaw | 0.0 /100 | #316 | Tragic 51.2% |
| Yakama | 0.0 /100 | #317 | Tragic 51.3% |
| Seminole | 0.0 /100 | #318 | Tragic 51.5% |
| Creek | 0.0 /100 | #319 | Tragic 51.5% |
Demographics Similar to Okinawans by Disability Age Over 75
In terms of disability age over 75, the demographic groups most similar to Okinawans are Immigrants from Lithuania (44.9%, a difference of 0.040%), Immigrants from Austria (44.9%, a difference of 0.12%), Luxembourger (44.8%, a difference of 0.13%), Carpatho Rusyn (44.8%, a difference of 0.19%), and Paraguayan (45.0%, a difference of 0.20%).
| Demographics | Rating | Rank | Disability Age Over 75 |
| Cypriots | 100.0 /100 | #1 | Exceptional 43.5% |
| Immigrants | Ireland | 100.0 /100 | #2 | Exceptional 44.7% |
| Eastern Europeans | 100.0 /100 | #3 | Exceptional 44.8% |
| Carpatho Rusyns | 100.0 /100 | #4 | Exceptional 44.8% |
| Luxembourgers | 100.0 /100 | #5 | Exceptional 44.8% |
| Immigrants | Lithuania | 100.0 /100 | #6 | Exceptional 44.9% |
| Okinawans | 100.0 /100 | #7 | Exceptional 44.9% |
| Immigrants | Austria | 100.0 /100 | #8 | Exceptional 44.9% |
| Paraguayans | 100.0 /100 | #9 | Exceptional 45.0% |
| Bulgarians | 100.0 /100 | #10 | Exceptional 45.1% |
| Lithuanians | 100.0 /100 | #11 | Exceptional 45.1% |
| Immigrants | Czechoslovakia | 100.0 /100 | #12 | Exceptional 45.1% |
| Latvians | 100.0 /100 | #13 | Exceptional 45.1% |
| Immigrants | Scotland | 100.0 /100 | #14 | Exceptional 45.1% |
| Immigrants | Sweden | 100.0 /100 | #15 | Exceptional 45.1% |