Cherokee vs Immigrants Male Disability
COMPARE
Cherokee
Immigrants
Male Disability
Male Disability Comparison
Cherokee
Immigrants
14.8%
MALE DISABILITY
0.0/ 100
METRIC RATING
334th/ 347
METRIC RANK
10.8%
MALE DISABILITY
93.9/ 100
METRIC RATING
110th/ 347
METRIC RANK
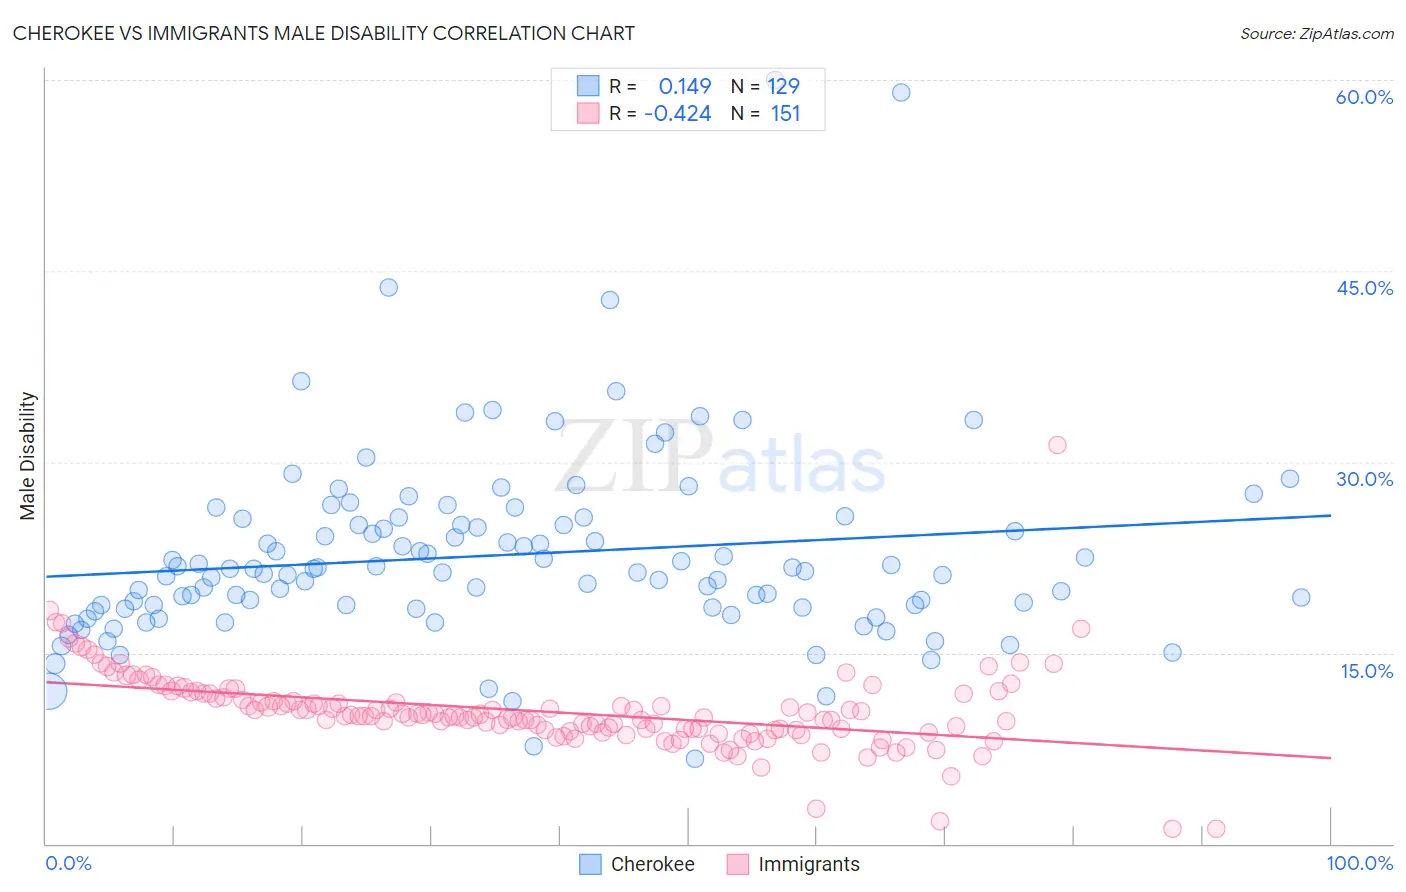
Cherokee vs Immigrants Male Disability Correlation Chart
The statistical analysis conducted on geographies consisting of 493,554,719 people shows a poor positive correlation between the proportion of Cherokee and percentage of males with a disability in the United States with a correlation coefficient (R) of 0.149 and weighted average of 14.8%. Similarly, the statistical analysis conducted on geographies consisting of 577,387,777 people shows a moderate negative correlation between the proportion of Immigrants and percentage of males with a disability in the United States with a correlation coefficient (R) of -0.424 and weighted average of 10.8%, a difference of 37.5%.
Male Disability Correlation Summary
| Measurement | Cherokee | Immigrants |
| Minimum | 6.7% | 1.2% |
| Maximum | 60.0% | 31.4% |
| Range | 53.3% | 30.2% |
| Mean | 22.7% | 10.4% |
| Median | 21.4% | 10.0% |
| Interquartile 25% (IQ1) | 18.5% | 8.9% |
| Interquartile 75% (IQ3) | 25.3% | 11.8% |
| Interquartile Range (IQR) | 6.7% | 2.8% |
| Standard Deviation (Sample) | 7.6% | 3.2% |
| Standard Deviation (Population) | 7.6% | 3.2% |
Similar Demographics by Male Disability
Demographics Similar to Cherokee by Male Disability
In terms of male disability, the demographic groups most similar to Cherokee are Dutch West Indian (14.8%, a difference of 0.020%), Alaskan Athabascan (14.9%, a difference of 0.49%), Yuman (14.7%, a difference of 0.68%), Seminole (14.7%, a difference of 0.78%), and Menominee (15.0%, a difference of 1.0%).
| Demographics | Rating | Rank | Male Disability |
| Potawatomi | 0.0 /100 | #327 | Tragic 14.2% |
| Chippewa | 0.0 /100 | #328 | Tragic 14.3% |
| Cajuns | 0.0 /100 | #329 | Tragic 14.4% |
| Navajo | 0.0 /100 | #330 | Tragic 14.4% |
| Tohono O'odham | 0.0 /100 | #331 | Tragic 14.6% |
| Seminole | 0.0 /100 | #332 | Tragic 14.7% |
| Yuman | 0.0 /100 | #333 | Tragic 14.7% |
| Cherokee | 0.0 /100 | #334 | Tragic 14.8% |
| Dutch West Indians | 0.0 /100 | #335 | Tragic 14.8% |
| Alaskan Athabascans | 0.0 /100 | #336 | Tragic 14.9% |
| Menominee | 0.0 /100 | #337 | Tragic 15.0% |
| Pueblo | 0.0 /100 | #338 | Tragic 15.0% |
| Chickasaw | 0.0 /100 | #339 | Tragic 15.1% |
| Lumbee | 0.0 /100 | #340 | Tragic 15.2% |
| Choctaw | 0.0 /100 | #341 | Tragic 15.4% |
Demographics Similar to Immigrants by Male Disability
In terms of male disability, the demographic groups most similar to Immigrants are Immigrants from Uganda (10.8%, a difference of 0.030%), Immigrants from Uruguay (10.8%, a difference of 0.040%), Immigrants from Belgium (10.8%, a difference of 0.080%), Immigrants from Eastern Africa (10.8%, a difference of 0.090%), and Ghanaian (10.8%, a difference of 0.14%).
| Demographics | Rating | Rank | Male Disability |
| Uruguayans | 95.3 /100 | #103 | Exceptional 10.7% |
| Immigrants | Nigeria | 95.1 /100 | #104 | Exceptional 10.8% |
| Immigrants | Brazil | 95.0 /100 | #105 | Exceptional 10.8% |
| Immigrants | Syria | 94.9 /100 | #106 | Exceptional 10.8% |
| Immigrants | Eastern Africa | 94.3 /100 | #107 | Exceptional 10.8% |
| Immigrants | Belgium | 94.2 /100 | #108 | Exceptional 10.8% |
| Immigrants | Uganda | 94.0 /100 | #109 | Exceptional 10.8% |
| Immigrants | Immigrants | 93.9 /100 | #110 | Exceptional 10.8% |
| Immigrants | Uruguay | 93.8 /100 | #111 | Exceptional 10.8% |
| Ghanaians | 93.4 /100 | #112 | Exceptional 10.8% |
| Immigrants | Zimbabwe | 93.0 /100 | #113 | Exceptional 10.8% |
| Central Americans | 92.7 /100 | #114 | Exceptional 10.8% |
| Immigrants | Barbados | 92.2 /100 | #115 | Exceptional 10.8% |
| Immigrants | South Africa | 91.8 /100 | #116 | Exceptional 10.8% |
| Eastern Europeans | 90.6 /100 | #117 | Exceptional 10.9% |