Cherokee vs Immigrants from Asia Male Disability
COMPARE
Cherokee
Immigrants from Asia
Male Disability
Male Disability Comparison
Cherokee
Immigrants from Asia
14.8%
MALE DISABILITY
0.0/ 100
METRIC RATING
334th/ 347
METRIC RANK
10.0%
MALE DISABILITY
100.0/ 100
METRIC RATING
24th/ 347
METRIC RANK
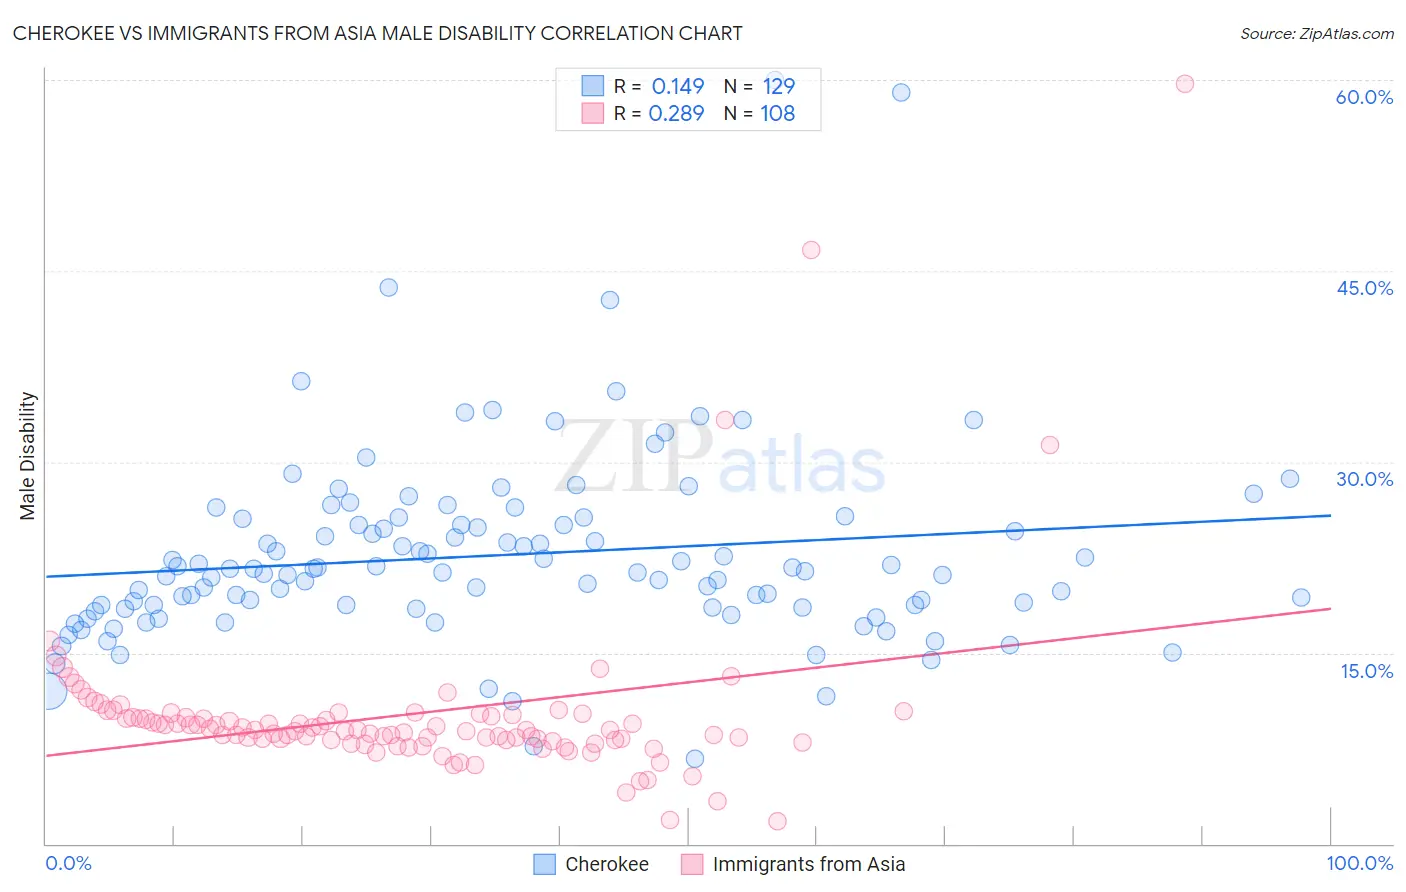
Cherokee vs Immigrants from Asia Male Disability Correlation Chart
The statistical analysis conducted on geographies consisting of 493,554,719 people shows a poor positive correlation between the proportion of Cherokee and percentage of males with a disability in the United States with a correlation coefficient (R) of 0.149 and weighted average of 14.8%. Similarly, the statistical analysis conducted on geographies consisting of 548,953,248 people shows a weak positive correlation between the proportion of Immigrants from Asia and percentage of males with a disability in the United States with a correlation coefficient (R) of 0.289 and weighted average of 10.0%, a difference of 48.0%.
Male Disability Correlation Summary
| Measurement | Cherokee | Immigrants from Asia |
| Minimum | 6.7% | 1.8% |
| Maximum | 60.0% | 59.7% |
| Range | 53.3% | 57.9% |
| Mean | 22.7% | 10.2% |
| Median | 21.4% | 8.9% |
| Interquartile 25% (IQ1) | 18.5% | 8.1% |
| Interquartile 75% (IQ3) | 25.3% | 10.1% |
| Interquartile Range (IQR) | 6.7% | 1.9% |
| Standard Deviation (Sample) | 7.6% | 7.1% |
| Standard Deviation (Population) | 7.6% | 7.1% |
Similar Demographics by Male Disability
Demographics Similar to Cherokee by Male Disability
In terms of male disability, the demographic groups most similar to Cherokee are Dutch West Indian (14.8%, a difference of 0.020%), Alaskan Athabascan (14.9%, a difference of 0.49%), Yuman (14.7%, a difference of 0.68%), Seminole (14.7%, a difference of 0.78%), and Menominee (15.0%, a difference of 1.0%).
| Demographics | Rating | Rank | Male Disability |
| Potawatomi | 0.0 /100 | #327 | Tragic 14.2% |
| Chippewa | 0.0 /100 | #328 | Tragic 14.3% |
| Cajuns | 0.0 /100 | #329 | Tragic 14.4% |
| Navajo | 0.0 /100 | #330 | Tragic 14.4% |
| Tohono O'odham | 0.0 /100 | #331 | Tragic 14.6% |
| Seminole | 0.0 /100 | #332 | Tragic 14.7% |
| Yuman | 0.0 /100 | #333 | Tragic 14.7% |
| Cherokee | 0.0 /100 | #334 | Tragic 14.8% |
| Dutch West Indians | 0.0 /100 | #335 | Tragic 14.8% |
| Alaskan Athabascans | 0.0 /100 | #336 | Tragic 14.9% |
| Menominee | 0.0 /100 | #337 | Tragic 15.0% |
| Pueblo | 0.0 /100 | #338 | Tragic 15.0% |
| Chickasaw | 0.0 /100 | #339 | Tragic 15.1% |
| Lumbee | 0.0 /100 | #340 | Tragic 15.2% |
| Choctaw | 0.0 /100 | #341 | Tragic 15.4% |
Demographics Similar to Immigrants from Asia by Male Disability
In terms of male disability, the demographic groups most similar to Immigrants from Asia are Cypriot (10.0%, a difference of 0.14%), Immigrants from Malaysia (10.0%, a difference of 0.19%), Immigrants from Venezuela (10.0%, a difference of 0.23%), Paraguayan (10.1%, a difference of 0.32%), and Burmese (10.0%, a difference of 0.51%).
| Demographics | Rating | Rank | Male Disability |
| Immigrants | Korea | 100.0 /100 | #17 | Exceptional 9.8% |
| Immigrants | Pakistan | 100.0 /100 | #18 | Exceptional 9.8% |
| Immigrants | Sri Lanka | 100.0 /100 | #19 | Exceptional 10.0% |
| Asians | 100.0 /100 | #20 | Exceptional 10.0% |
| Burmese | 100.0 /100 | #21 | Exceptional 10.0% |
| Immigrants | Venezuela | 100.0 /100 | #22 | Exceptional 10.0% |
| Cypriots | 100.0 /100 | #23 | Exceptional 10.0% |
| Immigrants | Asia | 100.0 /100 | #24 | Exceptional 10.0% |
| Immigrants | Malaysia | 99.9 /100 | #25 | Exceptional 10.0% |
| Paraguayans | 99.9 /100 | #26 | Exceptional 10.1% |
| Egyptians | 99.9 /100 | #27 | Exceptional 10.1% |
| Vietnamese | 99.9 /100 | #28 | Exceptional 10.1% |
| Venezuelans | 99.9 /100 | #29 | Exceptional 10.1% |
| Immigrants | Egypt | 99.9 /100 | #30 | Exceptional 10.1% |
| Soviet Union | 99.9 /100 | #31 | Exceptional 10.1% |