Cherokee vs Immigrants Unemployment Among Women with Children Under 18 years
COMPARE
Cherokee
Immigrants
Unemployment Among Women with Children Under 18 years
Unemployment Among Women with Children Under 18 years Comparison
Cherokee
Immigrants
5.7%
UNEMPLOYMENT AMONG WOMEN WITH CHILDREN UNDER 18 YEARS
4.3/ 100
METRIC RATING
226th/ 347
METRIC RANK
5.8%
UNEMPLOYMENT AMONG WOMEN WITH CHILDREN UNDER 18 YEARS
2.0/ 100
METRIC RATING
240th/ 347
METRIC RANK
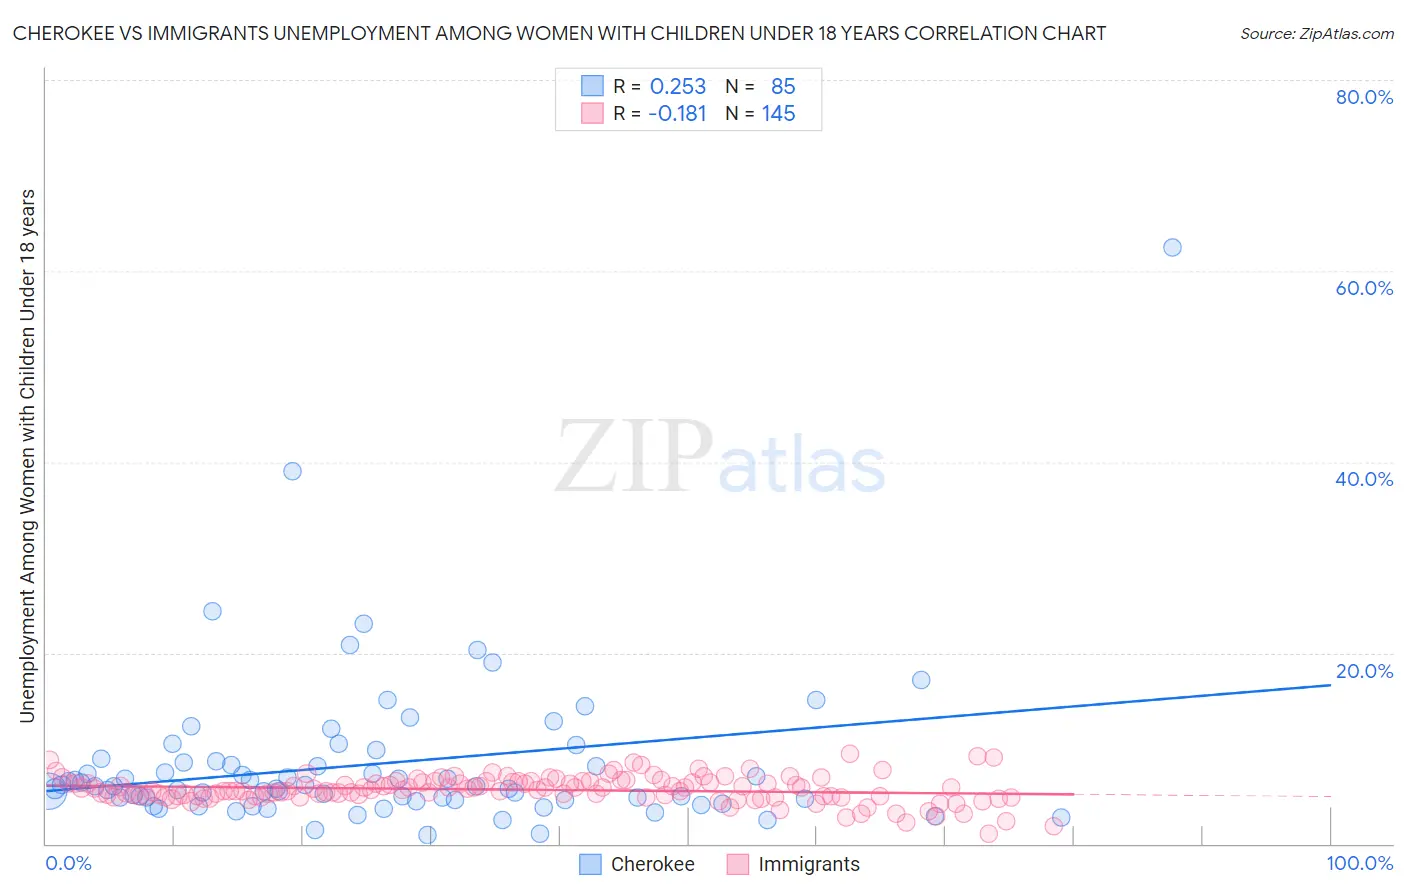
Cherokee vs Immigrants Unemployment Among Women with Children Under 18 years Correlation Chart
The statistical analysis conducted on geographies consisting of 460,921,532 people shows a weak positive correlation between the proportion of Cherokee and unemployment rate among women with children under the age of 18 in the United States with a correlation coefficient (R) of 0.253 and weighted average of 5.7%. Similarly, the statistical analysis conducted on geographies consisting of 521,116,845 people shows a poor negative correlation between the proportion of Immigrants and unemployment rate among women with children under the age of 18 in the United States with a correlation coefficient (R) of -0.181 and weighted average of 5.8%, a difference of 1.3%.
Unemployment Among Women with Children Under 18 years Correlation Summary
| Measurement | Cherokee | Immigrants |
| Minimum | 0.95% | 1.1% |
| Maximum | 62.5% | 9.4% |
| Range | 61.6% | 8.3% |
| Mean | 8.4% | 5.7% |
| Median | 6.0% | 5.6% |
| Interquartile 25% (IQ1) | 4.6% | 4.9% |
| Interquartile 75% (IQ3) | 8.6% | 6.5% |
| Interquartile Range (IQR) | 4.0% | 1.6% |
| Standard Deviation (Sample) | 8.4% | 1.4% |
| Standard Deviation (Population) | 8.3% | 1.4% |
Demographics Similar to Cherokee and Immigrants by Unemployment Among Women with Children Under 18 years
In terms of unemployment among women with children under 18 years, the demographic groups most similar to Cherokee are Armenian (5.7%, a difference of 0.070%), Immigrants from Syria (5.7%, a difference of 0.12%), Sierra Leonean (5.8%, a difference of 0.20%), Potawatomi (5.7%, a difference of 0.26%), and Somali (5.8%, a difference of 0.34%). Similarly, the demographic groups most similar to Immigrants are Immigrants from Sierra Leone (5.8%, a difference of 0.0%), Immigrants from Somalia (5.8%, a difference of 0.090%), Immigrants from Lebanon (5.8%, a difference of 0.27%), Alsatian (5.8%, a difference of 0.37%), and Brazilian (5.8%, a difference of 0.46%).
| Demographics | Rating | Rank | Unemployment Among Women with Children Under 18 years |
| Potawatomi | 5.0 /100 | #223 | Tragic 5.7% |
| Immigrants | Syria | 4.6 /100 | #224 | Tragic 5.7% |
| Armenians | 4.5 /100 | #225 | Tragic 5.7% |
| Cherokee | 4.3 /100 | #226 | Tragic 5.7% |
| Sierra Leoneans | 3.8 /100 | #227 | Tragic 5.8% |
| Somalis | 3.5 /100 | #228 | Tragic 5.8% |
| Immigrants | Panama | 3.4 /100 | #229 | Tragic 5.8% |
| Immigrants | South America | 3.2 /100 | #230 | Tragic 5.8% |
| Immigrants | Africa | 3.1 /100 | #231 | Tragic 5.8% |
| Creek | 3.1 /100 | #232 | Tragic 5.8% |
| Spanish Americans | 3.1 /100 | #233 | Tragic 5.8% |
| Guamanians/Chamorros | 2.9 /100 | #234 | Tragic 5.8% |
| Immigrants | Middle Africa | 2.8 /100 | #235 | Tragic 5.8% |
| Alsatians | 2.5 /100 | #236 | Tragic 5.8% |
| Immigrants | Lebanon | 2.4 /100 | #237 | Tragic 5.8% |
| Immigrants | Somalia | 2.2 /100 | #238 | Tragic 5.8% |
| Immigrants | Sierra Leone | 2.0 /100 | #239 | Tragic 5.8% |
| Immigrants | Immigrants | 2.0 /100 | #240 | Tragic 5.8% |
| Brazilians | 1.6 /100 | #241 | Tragic 5.8% |
| Moroccans | 1.4 /100 | #242 | Tragic 5.9% |
| Immigrants | Uruguay | 1.1 /100 | #243 | Tragic 5.9% |