Cherokee vs Immigrants Female Unemployment

COMPARE

Cherokee
Race
Ancestry
AfghanAfricanAlaska NativeAlaskan AthabascanAlbanianAleutAlsatianAmericanApacheArabArapahoArgentineanArmenianAssyrian/Chaldean/SyriacAustralianAustrianBahamianBangladeshiBarbadianBasqueBelgianBelizeanBermudanBhutaneseBlackfeetBolivianBrazilianBritishBritish West IndianBulgarianBurmeseCajunCambodianCanadianCape VerdeanCarpatho RusynCelticCentral AmericanCentral American IndianCherokeeCheyenneChickasawChileanChineseChippewaChoctawColombianColvilleComancheCosta RicanCreeCreekCroatianCrowCubanCypriotCzechCzechoslovakianDanishDelawareDominicanDutchDutch West IndianEastern EuropeanEcuadorianEgyptianEnglishEstonianEthiopianEuropeanFijianFilipinoFinnishFrenchFrench American IndianFrench CanadianGermanGerman RussianGhanaianGreekGuamanian/ChamorroGuatemalanGuyaneseHaitianHmongHonduranHopiHoumaHungarianIcelanderIndian (Asian)IndonesianInupiatIranianIraqiIrishIroquoisIsraeliItalianJamaicanJapaneseJordanianKenyanKiowaKoreanLaotianLatvianLebaneseLiberianLithuanianLumbeeLuxembourgerMacedonianMalaysianMalteseMarshalleseMenomineeMexicanMexican American IndianMongolianMoroccanNative HawaiianNavajoNepaleseNew ZealanderNicaraguanNigerianNorthern EuropeanNorwegianOkinawanOsageOttawaPaiutePakistaniPalestinianPanamanianParaguayanPennsylvania GermanPeruvianPimaPolishPortuguesePotawatomiPuebloPuerto RicanPuget Sound SalishRomanianRussianSalvadoranSamoanScandinavianScotch-IrishScottishSeminoleSenegaleseSerbianShoshoneSierra LeoneanSiouxSlavicSlovakSloveneSomaliSouth AfricanSouth AmericanSouth American IndianSoviet UnionSpaniardSpanishSpanish AmericanSpanish American IndianSri LankanSubsaharan AfricanSudaneseSwedishSwissSyrianTaiwaneseThaiTlingit-HaidaTohono O'OdhamTonganTrinidadian and TobagonianTsimshianTurkishU.S. Virgin IslanderUgandanUkrainianUruguayanUteVenezuelanVietnameseWelshWest IndianYakamaYaquiYugoslavianYumanYup'ikZimbabwean
Immigration
NonimmigrantsAfghanistanAfricaAlbaniaArgentinaArmeniaAsiaAustraliaAustriaBahamasBangladeshBarbadosBelarusBelgiumBelizeBoliviaBosnia and HerzegovinaBrazilBulgariaBurma/MyanmarCabo VerdeCambodiaCameroonCanadaCaribbeanCentral AmericaChileChinaColombiaCongoCosta RicaCroatiaCubaCzechoslovakiaDenmarkDominicaDominican RepublicEastern AfricaEastern AsiaEastern EuropeEcuadorEgyptEl SalvadorEnglandEritreaEthiopiaEuropeFijiFranceGermanyGhanaGreeceGrenadaGuatemalaGuyanaHaitiHondurasHong KongHungaryIndiaIndonesiaIranIraqIrelandIsraelItalyJamaicaJapanJordanKazakhstanKenyaKoreaKuwaitLaosLatin AmericaLatviaLebanonLiberiaLithuaniaMalaysiaMexicoMicronesiaMiddle AfricaMoldovaMoroccoNepalNetherlandsNicaraguaNigeriaNorth AmericaNorth MacedoniaNorthern AfricaNorthern EuropeNorwayOceaniaPakistanPanamaPeruPhilippinesPolandPortugalRomaniaRussiaSaudi ArabiaScotlandSenegalSerbiaSierra LeoneSingaporeSomaliaSouth AfricaSouth AmericaSouth Central AsiaSouth Eastern AsiaSouthern EuropeSpainSri LankaSt. Vincent and the GrenadinesSudanSwedenSwitzerlandSyriaTaiwanThailandTrinidad and TobagoTurkeyUgandaUkraineUruguayUzbekistanVenezuelaVietnamWest IndiesWestern AfricaWestern AsiaWestern EuropeYemenZaireZimbabweAzores
Immigrants
Race
Ancestry
AfghanAfricanAlaska NativeAlaskan AthabascanAlbanianAleutAlsatianAmericanApacheArabArapahoArgentineanArmenianAssyrian/Chaldean/SyriacAustralianAustrianBahamianBangladeshiBarbadianBasqueBelgianBelizeanBermudanBhutaneseBlackfeetBolivianBrazilianBritishBritish West IndianBulgarianBurmeseCajunCambodianCanadianCape VerdeanCarpatho RusynCelticCentral AmericanCentral American IndianCheyenneChickasawChileanChineseChippewaChoctawColombianColvilleComancheCosta RicanCreeCreekCroatianCrowCubanCypriotCzechCzechoslovakianDanishDelawareDominicanDutchDutch West IndianEastern EuropeanEcuadorianEgyptianEnglishEstonianEthiopianEuropeanFijianFilipinoFinnishFrenchFrench American IndianFrench CanadianGermanGerman RussianGhanaianGreekGuamanian/ChamorroGuatemalanGuyaneseHaitianHmongHonduranHopiHoumaHungarianIcelanderIndian (Asian)IndonesianInupiatIranianIraqiIrishIroquoisIsraeliItalianJamaicanJapaneseJordanianKenyanKiowaKoreanLaotianLatvianLebaneseLiberianLithuanianLumbeeLuxembourgerMacedonianMalaysianMalteseMarshalleseMenomineeMexicanMexican American IndianMongolianMoroccanNative HawaiianNavajoNepaleseNew ZealanderNicaraguanNigerianNorthern EuropeanNorwegianOkinawanOsageOttawaPaiutePakistaniPalestinianPanamanianParaguayanPennsylvania GermanPeruvianPimaPolishPortuguesePotawatomiPuebloPuerto RicanPuget Sound SalishRomanianRussianSalvadoranSamoanScandinavianScotch-IrishScottishSeminoleSenegaleseSerbianShoshoneSierra LeoneanSiouxSlavicSlovakSloveneSomaliSouth AfricanSouth AmericanSouth American IndianSoviet UnionSpaniardSpanishSpanish AmericanSpanish American IndianSri LankanSubsaharan AfricanSudaneseSwedishSwissSyrianTaiwaneseThaiTlingit-HaidaTohono O'OdhamTonganTrinidadian and TobagonianTsimshianTurkishU.S. Virgin IslanderUgandanUkrainianUruguayanUteVenezuelanVietnameseWelshWest IndianYakamaYaquiYugoslavianYumanYup'ikZimbabwean
Immigration
NonimmigrantsImmigrantsAfghanistanAfricaAlbaniaArgentinaArmeniaAsiaAustraliaAustriaBahamasBangladeshBarbadosBelarusBelgiumBelizeBoliviaBosnia and HerzegovinaBrazilBulgariaBurma/MyanmarCabo VerdeCambodiaCameroonCanadaCaribbeanCentral AmericaChileChinaColombiaCongoCosta RicaCroatiaCubaCzechoslovakiaDenmarkDominicaDominican RepublicEastern AfricaEastern AsiaEastern EuropeEcuadorEgyptEl SalvadorEnglandEritreaEthiopiaEuropeFijiFranceGermanyGhanaGreeceGrenadaGuatemalaGuyanaHaitiHondurasHong KongHungaryIndiaIndonesiaIranIraqIrelandIsraelItalyJamaicaJapanJordanKazakhstanKenyaKoreaKuwaitLaosLatin AmericaLatviaLebanonLiberiaLithuaniaMalaysiaMexicoMicronesiaMiddle AfricaMoldovaMoroccoNepalNetherlandsNicaraguaNigeriaNorth AmericaNorth MacedoniaNorthern AfricaNorthern EuropeNorwayOceaniaPakistanPanamaPeruPhilippinesPolandPortugalRomaniaRussiaSaudi ArabiaScotlandSenegalSerbiaSierra LeoneSingaporeSomaliaSouth AfricaSouth AmericaSouth Central AsiaSouth Eastern AsiaSouthern EuropeSpainSri LankaSt. Vincent and the GrenadinesSudanSwedenSwitzerlandSyriaTaiwanThailandTrinidad and TobagoTurkeyUgandaUkraineUruguayUzbekistanVenezuelaVietnamWest IndiesWestern AfricaWestern AsiaWestern EuropeYemenZaireZimbabweAzores
Female Unemployment
Income
Poverty
Unemployment
Labor Participation
Family Structure
Vehicle Availability
Education Level
Disability

Female Unemployment Comparison

Cherokee

Immigrants

Fair
Tragic
5.3%
FEMALE UNEMPLOYMENT
30.8/ 100
METRIC RATING
191st/ 347
METRIC RANK
5.7%
FEMALE UNEMPLOYMENT
0.6/ 100
METRIC RATING
254th/ 347
METRIC RANK

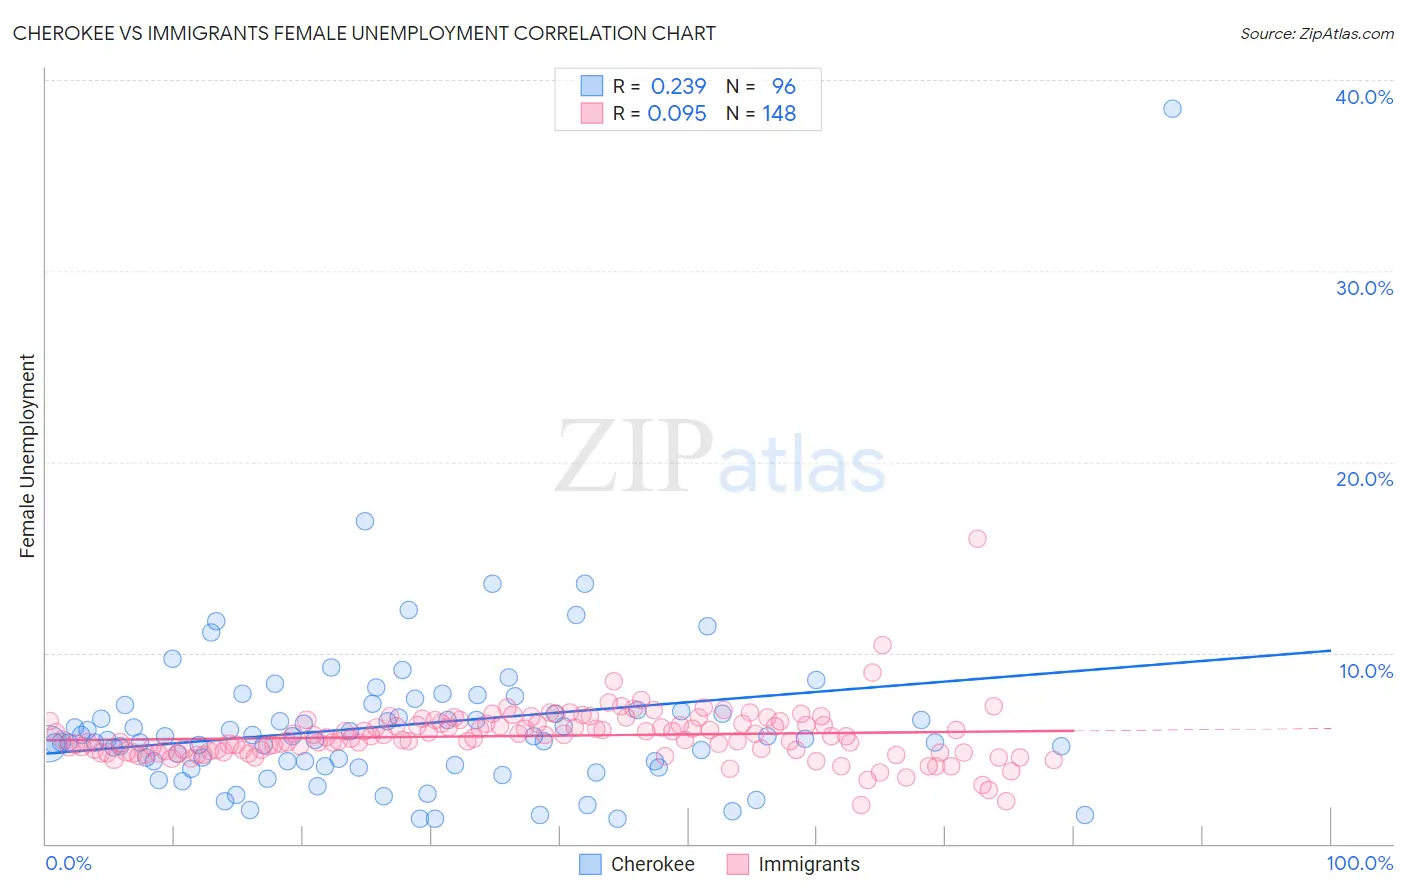
Cherokee vs Immigrants Female Unemployment Correlation Chart

The statistical analysis conducted on geographies consisting of 487,346,923 people shows a weak positive correlation between the proportion of Cherokee and unemploymnet rate among females in the United States with a correlation coefficient (R) of 0.239 and weighted average of 5.3%. Similarly, the statistical analysis conducted on geographies consisting of 563,480,166 people shows a slight positive correlation between the proportion of Immigrants and unemploymnet rate among females in the United States with a correlation coefficient (R) of 0.095 and weighted average of 5.7%, a difference of 6.4%.
Cherokee vs Immigrants Female Unemployment

Female Unemployment Correlation Summary

MeasurementCherokeeImmigrants
Minimum1.3%2.0%
Maximum38.5%16.0%
Range37.2%14.0%
Mean6.2%5.6%
Median5.5%5.5%
Interquartile 25% (IQ1)4.2%4.8%
Interquartile 75% (IQ3)7.0%6.3%
Interquartile Range (IQR)2.8%1.4%
Standard Deviation (Sample)4.4%1.4%
Standard Deviation (Population)4.4%1.4%

Similar Demographics by Female Unemployment

Demographics Similar to Cherokee by Female Unemployment

In terms of female unemployment, the demographic groups most similar to Cherokee are Ugandan (5.3%, a difference of 0.030%), Portuguese (5.3%, a difference of 0.16%), Costa Rican (5.3%, a difference of 0.20%), Afghan (5.3%, a difference of 0.21%), and Arab (5.3%, a difference of 0.23%).
DemographicsRating | RankFemale Unemployment
Immigrants | Ukraine
40.1
/100
|
#184
Average
5.3%
Malaysians
40.1
/100
|
#185
Average
5.3%
Immigrants | Belarus
39.4
/100
|
#186
Fair
5.3%
Immigrants | Albania
35.4
/100
|
#187
Fair
5.3%
Afghans
33.9
/100
|
#188
Fair
5.3%
Costa Ricans
33.8
/100
|
#189
Fair
5.3%
Ugandans
31.2
/100
|
#190
Fair
5.3%
Cherokee
30.8
/100
|
#191
Fair
5.3%
Portuguese
28.6
/100
|
#192
Fair
5.3%
Arabs
27.7
/100
|
#193
Fair
5.3%
Colombians
27.0
/100
|
#194
Fair
5.3%
Immigrants | Colombia
26.2
/100
|
#195
Fair
5.3%
Spaniards
25.2
/100
|
#196
Fair
5.3%
Alsatians
23.9
/100
|
#197
Fair
5.3%
Tsimshian
23.1
/100
|
#198
Fair
5.4%

Demographics Similar to Immigrants by Female Unemployment

In terms of female unemployment, the demographic groups most similar to Immigrants are Immigrants from Sierra Leone (5.7%, a difference of 0.0%), Immigrants from Cameroon (5.7%, a difference of 0.040%), Cajun (5.7%, a difference of 0.15%), Assyrian/Chaldean/Syriac (5.6%, a difference of 0.34%), and Immigrants from Syria (5.6%, a difference of 0.41%).
DemographicsRating | RankFemale Unemployment
Immigrants | Western Asia
1.1
/100
|
#247
Tragic
5.6%
Cree
1.0
/100
|
#248
Tragic
5.6%
Immigrants | Uzbekistan
1.0
/100
|
#249
Tragic
5.6%
Immigrants | Syria
0.8
/100
|
#250
Tragic
5.6%
Assyrians/Chaldeans/Syriacs
0.8
/100
|
#251
Tragic
5.6%
Cajuns
0.7
/100
|
#252
Tragic
5.7%
Immigrants | Sierra Leone
0.6
/100
|
#253
Tragic
5.7%
Immigrants | Immigrants
0.6
/100
|
#254
Tragic
5.7%
Immigrants | Cameroon
0.6
/100
|
#255
Tragic
5.7%
Sub-Saharan Africans
0.4
/100
|
#256
Tragic
5.7%
Dutch West Indians
0.3
/100
|
#257
Tragic
5.7%
Immigrants | Portugal
0.2
/100
|
#258
Tragic
5.8%
Immigrants | Fiji
0.2
/100
|
#259
Tragic
5.8%
Nigerians
0.2
/100
|
#260
Tragic
5.8%
Kiowa
0.1
/100
|
#261
Tragic
5.8%