Immigrants from Latvia vs Immigrants Male Disability
COMPARE
Immigrants from Latvia
Immigrants
Male Disability
Male Disability Comparison
Immigrants from Latvia
Immigrants
10.9%
MALE DISABILITY
85.5/ 100
METRIC RATING
128th/ 347
METRIC RANK
10.8%
MALE DISABILITY
93.9/ 100
METRIC RATING
110th/ 347
METRIC RANK
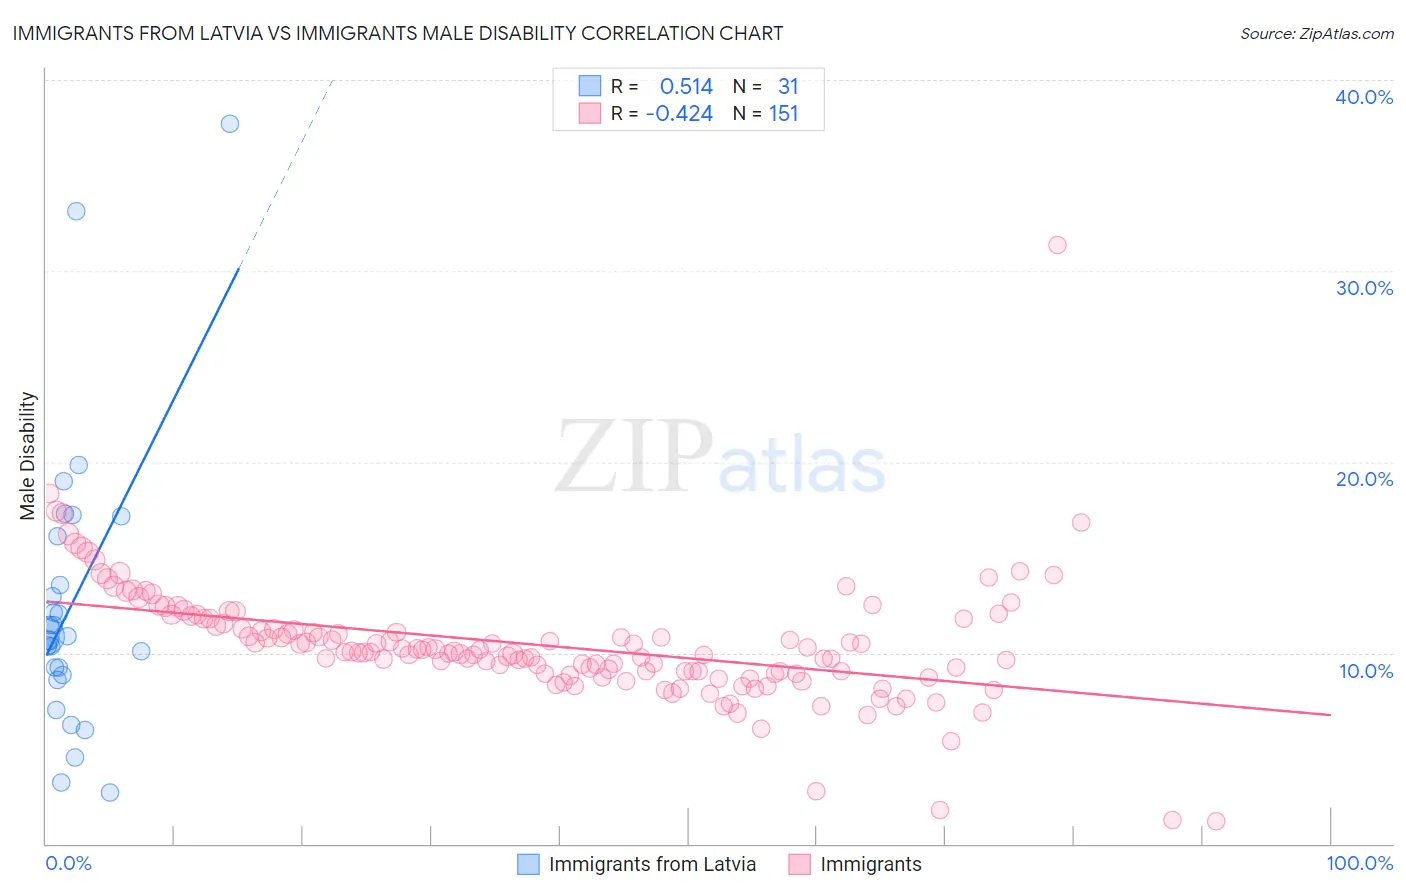
Immigrants from Latvia vs Immigrants Male Disability Correlation Chart
The statistical analysis conducted on geographies consisting of 113,739,259 people shows a substantial positive correlation between the proportion of Immigrants from Latvia and percentage of males with a disability in the United States with a correlation coefficient (R) of 0.514 and weighted average of 10.9%. Similarly, the statistical analysis conducted on geographies consisting of 577,387,777 people shows a moderate negative correlation between the proportion of Immigrants and percentage of males with a disability in the United States with a correlation coefficient (R) of -0.424 and weighted average of 10.8%, a difference of 1.4%.
Male Disability Correlation Summary
| Measurement | Immigrants from Latvia | Immigrants |
| Minimum | 2.7% | 1.2% |
| Maximum | 37.7% | 31.4% |
| Range | 35.1% | 30.2% |
| Mean | 12.6% | 10.4% |
| Median | 10.8% | 10.0% |
| Interquartile 25% (IQ1) | 8.9% | 8.9% |
| Interquartile 75% (IQ3) | 16.1% | 11.8% |
| Interquartile Range (IQR) | 7.2% | 2.8% |
| Standard Deviation (Sample) | 7.5% | 3.2% |
| Standard Deviation (Population) | 7.4% | 3.2% |
Demographics Similar to Immigrants from Latvia and Immigrants by Male Disability
In terms of male disability, the demographic groups most similar to Immigrants from Latvia are Immigrants from Philippines (10.9%, a difference of 0.0%), Immigrants from Ukraine (10.9%, a difference of 0.16%), Immigrants from Trinidad and Tobago (10.9%, a difference of 0.17%), South American Indian (10.9%, a difference of 0.33%), and Immigrants from North Macedonia (10.9%, a difference of 0.33%). Similarly, the demographic groups most similar to Immigrants are Immigrants from Uganda (10.8%, a difference of 0.030%), Immigrants from Uruguay (10.8%, a difference of 0.040%), Ghanaian (10.8%, a difference of 0.14%), Immigrants from Zimbabwe (10.8%, a difference of 0.22%), and Central American (10.8%, a difference of 0.29%).
| Demographics | Rating | Rank | Male Disability |
| Immigrants | Uganda | 94.0 /100 | #109 | Exceptional 10.8% |
| Immigrants | Immigrants | 93.9 /100 | #110 | Exceptional 10.8% |
| Immigrants | Uruguay | 93.8 /100 | #111 | Exceptional 10.8% |
| Ghanaians | 93.4 /100 | #112 | Exceptional 10.8% |
| Immigrants | Zimbabwe | 93.0 /100 | #113 | Exceptional 10.8% |
| Central Americans | 92.7 /100 | #114 | Exceptional 10.8% |
| Immigrants | Barbados | 92.2 /100 | #115 | Exceptional 10.8% |
| Immigrants | South Africa | 91.8 /100 | #116 | Exceptional 10.8% |
| Eastern Europeans | 90.6 /100 | #117 | Exceptional 10.9% |
| Immigrants | Cuba | 90.2 /100 | #118 | Exceptional 10.9% |
| Armenians | 90.1 /100 | #119 | Exceptional 10.9% |
| Immigrants | Africa | 89.4 /100 | #120 | Excellent 10.9% |
| Immigrants | South Eastern Asia | 89.2 /100 | #121 | Excellent 10.9% |
| Immigrants | Ghana | 89.0 /100 | #122 | Excellent 10.9% |
| Immigrants | Czechoslovakia | 88.4 /100 | #123 | Excellent 10.9% |
| South American Indians | 88.1 /100 | #124 | Excellent 10.9% |
| Immigrants | North Macedonia | 88.1 /100 | #125 | Excellent 10.9% |
| Immigrants | Trinidad and Tobago | 86.9 /100 | #126 | Excellent 10.9% |
| Immigrants | Ukraine | 86.8 /100 | #127 | Excellent 10.9% |
| Immigrants | Latvia | 85.5 /100 | #128 | Excellent 10.9% |
| Immigrants | Philippines | 85.4 /100 | #129 | Excellent 10.9% |