Cherokee vs Bulgarian Self-Care Disability
COMPARE
Cherokee
Bulgarian
Self-Care Disability
Self-Care Disability Comparison
Cherokee
Bulgarians
2.9%
SELF-CARE DISABILITY
0.0/ 100
METRIC RATING
324th/ 347
METRIC RANK
2.2%
SELF-CARE DISABILITY
100.0/ 100
METRIC RATING
21st/ 347
METRIC RANK
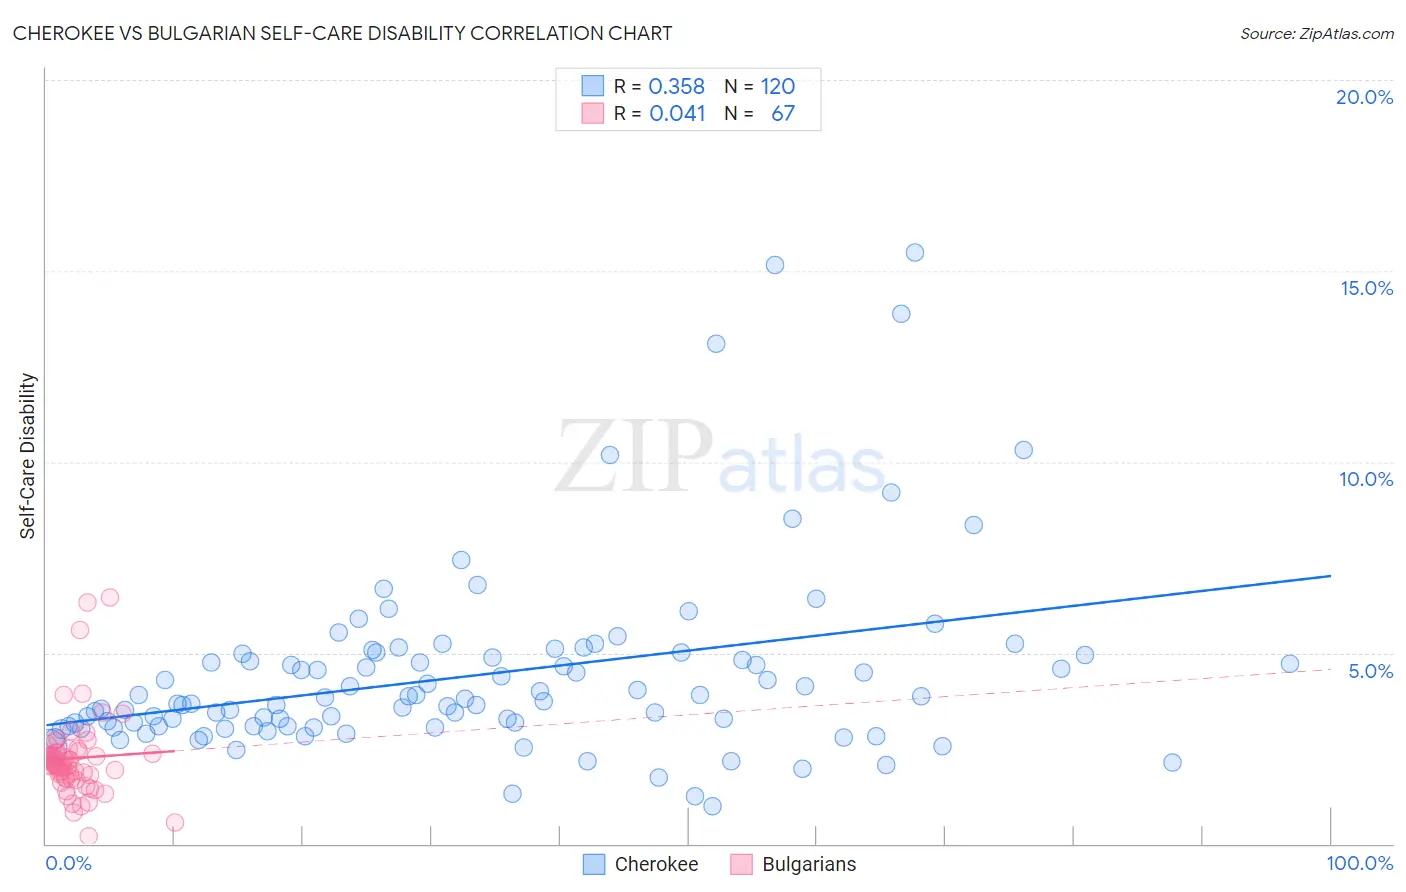
Cherokee vs Bulgarian Self-Care Disability Correlation Chart
The statistical analysis conducted on geographies consisting of 492,732,584 people shows a mild positive correlation between the proportion of Cherokee and percentage of population with self-care disability in the United States with a correlation coefficient (R) of 0.358 and weighted average of 2.9%. Similarly, the statistical analysis conducted on geographies consisting of 205,516,049 people shows no correlation between the proportion of Bulgarians and percentage of population with self-care disability in the United States with a correlation coefficient (R) of 0.041 and weighted average of 2.2%, a difference of 29.2%.
Self-Care Disability Correlation Summary
| Measurement | Cherokee | Bulgarian |
| Minimum | 0.97% | 0.21% |
| Maximum | 15.5% | 6.5% |
| Range | 14.5% | 6.2% |
| Mean | 4.4% | 2.2% |
| Median | 3.8% | 2.1% |
| Interquartile 25% (IQ1) | 3.1% | 1.7% |
| Interquartile 75% (IQ3) | 4.9% | 2.4% |
| Interquartile Range (IQR) | 1.8% | 0.68% |
| Standard Deviation (Sample) | 2.5% | 1.1% |
| Standard Deviation (Population) | 2.5% | 1.1% |
Similar Demographics by Self-Care Disability
Demographics Similar to Cherokee by Self-Care Disability
In terms of self-care disability, the demographic groups most similar to Cherokee are Seminole (2.9%, a difference of 0.10%), Comanche (2.9%, a difference of 0.22%), Immigrants from Uzbekistan (2.9%, a difference of 0.53%), Navajo (2.9%, a difference of 0.55%), and Chickasaw (2.9%, a difference of 0.70%).
| Demographics | Rating | Rank | Self-Care Disability |
| Immigrants | Dominica | 0.0 /100 | #317 | Tragic 2.8% |
| Assyrians/Chaldeans/Syriacs | 0.0 /100 | #318 | Tragic 2.8% |
| Spanish American Indians | 0.0 /100 | #319 | Tragic 2.9% |
| Chickasaw | 0.0 /100 | #320 | Tragic 2.9% |
| Navajo | 0.0 /100 | #321 | Tragic 2.9% |
| Comanche | 0.0 /100 | #322 | Tragic 2.9% |
| Seminole | 0.0 /100 | #323 | Tragic 2.9% |
| Cherokee | 0.0 /100 | #324 | Tragic 2.9% |
| Immigrants | Uzbekistan | 0.0 /100 | #325 | Tragic 2.9% |
| Paiute | 0.0 /100 | #326 | Tragic 2.9% |
| Blacks/African Americans | 0.0 /100 | #327 | Tragic 2.9% |
| Hopi | 0.0 /100 | #328 | Tragic 2.9% |
| Cajuns | 0.0 /100 | #329 | Tragic 2.9% |
| Nepalese | 0.0 /100 | #330 | Tragic 3.0% |
| Lumbee | 0.0 /100 | #331 | Tragic 3.0% |
Demographics Similar to Bulgarians by Self-Care Disability
In terms of self-care disability, the demographic groups most similar to Bulgarians are Immigrants from Venezuela (2.2%, a difference of 0.040%), Tongan (2.2%, a difference of 0.25%), Cambodian (2.2%, a difference of 0.25%), Immigrants from Eritrea (2.2%, a difference of 0.33%), and Cypriot (2.2%, a difference of 0.55%).
| Demographics | Rating | Rank | Self-Care Disability |
| Luxembourgers | 100.0 /100 | #14 | Exceptional 2.2% |
| Okinawans | 100.0 /100 | #15 | Exceptional 2.2% |
| Immigrants | Kuwait | 100.0 /100 | #16 | Exceptional 2.2% |
| Immigrants | Saudi Arabia | 100.0 /100 | #17 | Exceptional 2.2% |
| Immigrants | Taiwan | 100.0 /100 | #18 | Exceptional 2.2% |
| Immigrants | Eritrea | 100.0 /100 | #19 | Exceptional 2.2% |
| Tongans | 100.0 /100 | #20 | Exceptional 2.2% |
| Bulgarians | 100.0 /100 | #21 | Exceptional 2.2% |
| Immigrants | Venezuela | 100.0 /100 | #22 | Exceptional 2.2% |
| Cambodians | 100.0 /100 | #23 | Exceptional 2.2% |
| Cypriots | 100.0 /100 | #24 | Exceptional 2.2% |
| Turks | 100.0 /100 | #25 | Exceptional 2.2% |
| Immigrants | Sri Lanka | 99.9 /100 | #26 | Exceptional 2.2% |
| Venezuelans | 99.9 /100 | #27 | Exceptional 2.2% |
| Inupiat | 99.9 /100 | #28 | Exceptional 2.2% |