Central American vs Dutch West Indian Hearing Disability
COMPARE
Central American
Dutch West Indian
Hearing Disability
Hearing Disability Comparison
Central Americans
Dutch West Indians
2.7%
HEARING DISABILITY
97.7/ 100
METRIC RATING
71st/ 347
METRIC RANK
4.3%
HEARING DISABILITY
0.0/ 100
METRIC RATING
333rd/ 347
METRIC RANK
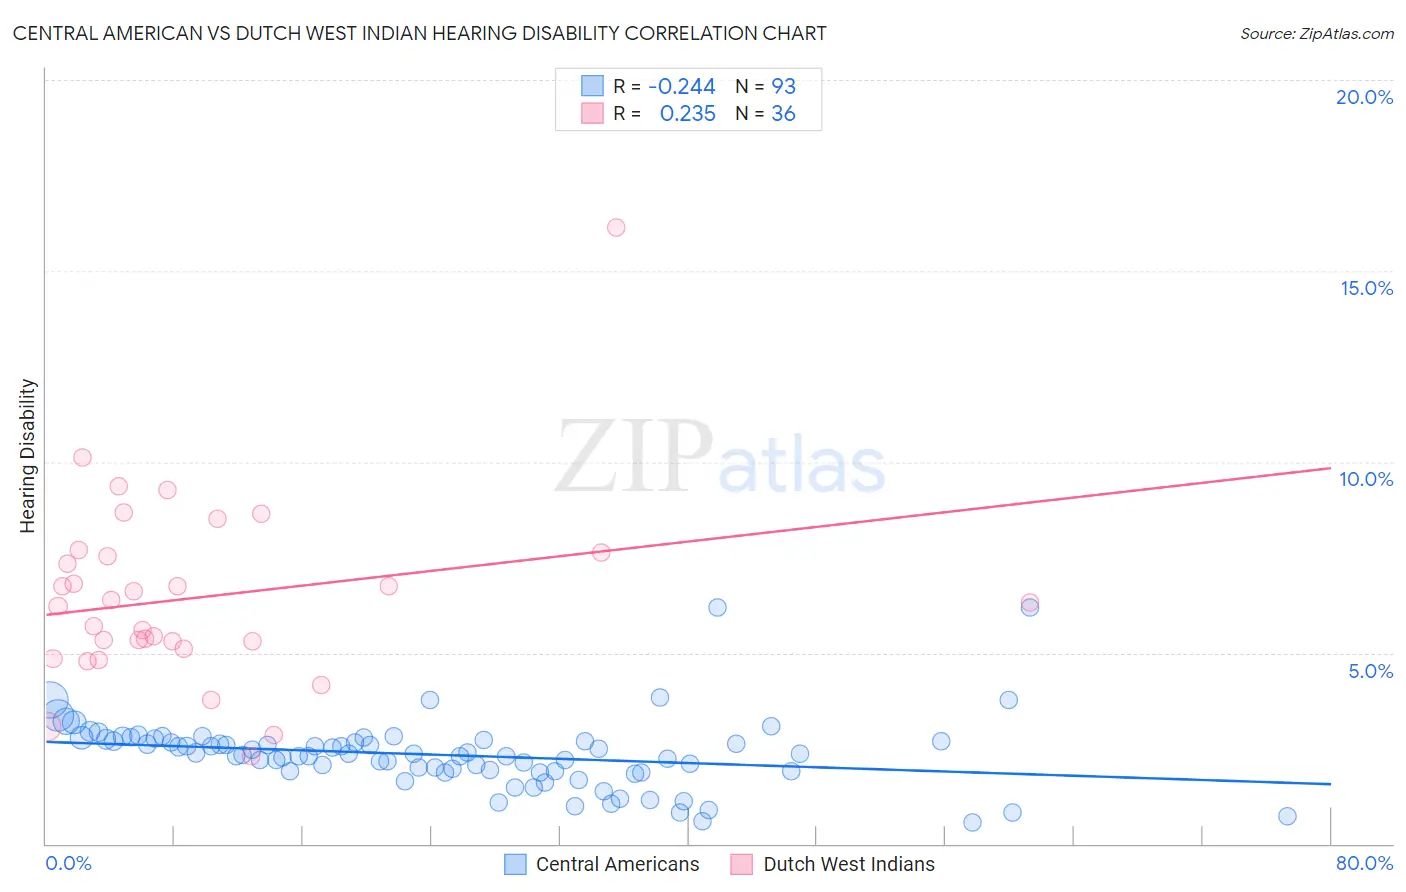
Central American vs Dutch West Indian Hearing Disability Correlation Chart
The statistical analysis conducted on geographies consisting of 504,204,845 people shows a weak negative correlation between the proportion of Central Americans and percentage of population with hearing disability in the United States with a correlation coefficient (R) of -0.244 and weighted average of 2.7%. Similarly, the statistical analysis conducted on geographies consisting of 85,766,796 people shows a weak positive correlation between the proportion of Dutch West Indians and percentage of population with hearing disability in the United States with a correlation coefficient (R) of 0.235 and weighted average of 4.3%, a difference of 55.9%.
Hearing Disability Correlation Summary
| Measurement | Central American | Dutch West Indian |
| Minimum | 0.55% | 2.3% |
| Maximum | 6.2% | 16.1% |
| Range | 5.7% | 13.9% |
| Mean | 2.3% | 6.5% |
| Median | 2.4% | 6.3% |
| Interquartile 25% (IQ1) | 1.9% | 5.2% |
| Interquartile 75% (IQ3) | 2.7% | 7.6% |
| Interquartile Range (IQR) | 0.81% | 2.4% |
| Standard Deviation (Sample) | 0.91% | 2.5% |
| Standard Deviation (Population) | 0.91% | 2.4% |
Similar Demographics by Hearing Disability
Demographics Similar to Central Americans by Hearing Disability
In terms of hearing disability, the demographic groups most similar to Central Americans are Peruvian (2.7%, a difference of 0.050%), Afghan (2.7%, a difference of 0.10%), Argentinean (2.7%, a difference of 0.18%), Immigrants from Korea (2.7%, a difference of 0.18%), and Immigrants from Saudi Arabia (2.7%, a difference of 0.21%).
| Demographics | Rating | Rank | Hearing Disability |
| Immigrants | Sri Lanka | 98.4 /100 | #64 | Exceptional 2.7% |
| Immigrants | Nepal | 98.3 /100 | #65 | Exceptional 2.7% |
| Immigrants | Belize | 98.2 /100 | #66 | Exceptional 2.7% |
| Egyptians | 98.1 /100 | #67 | Exceptional 2.7% |
| Immigrants | Africa | 98.0 /100 | #68 | Exceptional 2.7% |
| Nicaraguans | 97.9 /100 | #69 | Exceptional 2.7% |
| Peruvians | 97.7 /100 | #70 | Exceptional 2.7% |
| Central Americans | 97.7 /100 | #71 | Exceptional 2.7% |
| Afghans | 97.6 /100 | #72 | Exceptional 2.7% |
| Argentineans | 97.5 /100 | #73 | Exceptional 2.7% |
| Immigrants | Korea | 97.5 /100 | #74 | Exceptional 2.7% |
| Immigrants | Saudi Arabia | 97.5 /100 | #75 | Exceptional 2.7% |
| Asians | 97.5 /100 | #76 | Exceptional 2.7% |
| Immigrants | Malaysia | 97.5 /100 | #77 | Exceptional 2.7% |
| Mongolians | 97.4 /100 | #78 | Exceptional 2.7% |
Demographics Similar to Dutch West Indians by Hearing Disability
In terms of hearing disability, the demographic groups most similar to Dutch West Indians are Aleut (4.3%, a difference of 0.54%), Houma (4.2%, a difference of 0.59%), Cherokee (4.2%, a difference of 1.3%), Native/Alaskan (4.2%, a difference of 1.4%), and Kiowa (4.3%, a difference of 1.9%).
| Demographics | Rating | Rank | Hearing Disability |
| Potawatomi | 0.0 /100 | #326 | Tragic 4.1% |
| Arapaho | 0.0 /100 | #327 | Tragic 4.1% |
| Tohono O'odham | 0.0 /100 | #328 | Tragic 4.2% |
| Crow | 0.0 /100 | #329 | Tragic 4.2% |
| Natives/Alaskans | 0.0 /100 | #330 | Tragic 4.2% |
| Cherokee | 0.0 /100 | #331 | Tragic 4.2% |
| Houma | 0.0 /100 | #332 | Tragic 4.2% |
| Dutch West Indians | 0.0 /100 | #333 | Tragic 4.3% |
| Aleuts | 0.0 /100 | #334 | Tragic 4.3% |
| Kiowa | 0.0 /100 | #335 | Tragic 4.3% |
| Creek | 0.0 /100 | #336 | Tragic 4.4% |
| Chickasaw | 0.0 /100 | #337 | Tragic 4.5% |
| Alaska Natives | 0.0 /100 | #338 | Tragic 4.5% |
| Choctaw | 0.0 /100 | #339 | Tragic 4.5% |
| Pueblo | 0.0 /100 | #340 | Tragic 4.6% |