Central American Indian vs Laotian Disability Age 5 to 17
COMPARE
Central American Indian
Laotian
Disability Age 5 to 17
Disability Age 5 to 17 Comparison
Central American Indians
Laotians
6.2%
DISABILITY AGE 5 TO 17
0.0/ 100
METRIC RATING
293rd/ 347
METRIC RANK
5.1%
DISABILITY AGE 5 TO 17
99.9/ 100
METRIC RATING
55th/ 347
METRIC RANK
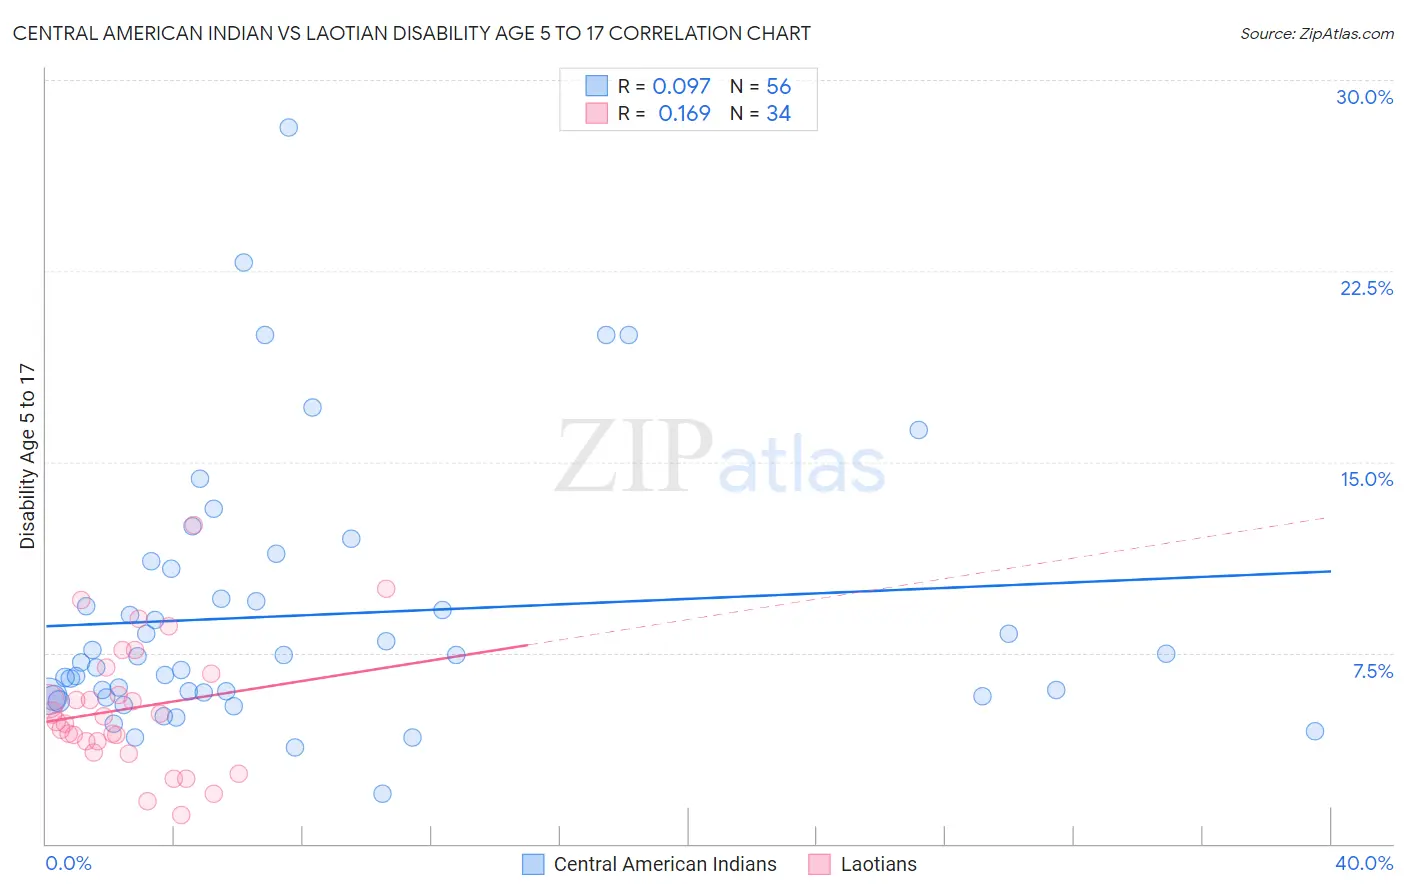
Central American Indian vs Laotian Disability Age 5 to 17 Correlation Chart
The statistical analysis conducted on geographies consisting of 324,856,277 people shows a slight positive correlation between the proportion of Central American Indians and percentage of population with a disability between the ages 5 and 17 in the United States with a correlation coefficient (R) of 0.097 and weighted average of 6.2%. Similarly, the statistical analysis conducted on geographies consisting of 223,927,841 people shows a poor positive correlation between the proportion of Laotians and percentage of population with a disability between the ages 5 and 17 in the United States with a correlation coefficient (R) of 0.169 and weighted average of 5.1%, a difference of 21.6%.
Disability Age 5 to 17 Correlation Summary
| Measurement | Central American Indian | Laotian |
| Minimum | 2.0% | 1.1% |
| Maximum | 28.1% | 12.5% |
| Range | 26.2% | 11.4% |
| Mean | 9.0% | 5.3% |
| Median | 7.2% | 4.9% |
| Interquartile 25% (IQ1) | 5.8% | 4.0% |
| Interquartile 75% (IQ3) | 10.2% | 6.7% |
| Interquartile Range (IQR) | 4.4% | 2.7% |
| Standard Deviation (Sample) | 5.2% | 2.5% |
| Standard Deviation (Population) | 5.2% | 2.5% |
Similar Demographics by Disability Age 5 to 17
Demographics Similar to Central American Indians by Disability Age 5 to 17
In terms of disability age 5 to 17, the demographic groups most similar to Central American Indians are Irish (6.2%, a difference of 0.0%), Immigrants from Senegal (6.2%, a difference of 0.020%), White/Caucasian (6.2%, a difference of 0.26%), Cree (6.2%, a difference of 0.28%), and Spanish American (6.2%, a difference of 0.30%).
| Demographics | Rating | Rank | Disability Age 5 to 17 |
| Colville | 0.0 /100 | #286 | Tragic 6.2% |
| Pima | 0.0 /100 | #287 | Tragic 6.2% |
| Jamaicans | 0.0 /100 | #288 | Tragic 6.2% |
| Yaqui | 0.0 /100 | #289 | Tragic 6.2% |
| Immigrants | Congo | 0.0 /100 | #290 | Tragic 6.2% |
| Whites/Caucasians | 0.0 /100 | #291 | Tragic 6.2% |
| Immigrants | Senegal | 0.0 /100 | #292 | Tragic 6.2% |
| Central American Indians | 0.0 /100 | #293 | Tragic 6.2% |
| Irish | 0.0 /100 | #294 | Tragic 6.2% |
| Cree | 0.0 /100 | #295 | Tragic 6.2% |
| Spanish Americans | 0.0 /100 | #296 | Tragic 6.2% |
| Immigrants | Bahamas | 0.0 /100 | #297 | Tragic 6.2% |
| Lumbee | 0.0 /100 | #298 | Tragic 6.2% |
| Welsh | 0.0 /100 | #299 | Tragic 6.3% |
| Carpatho Rusyns | 0.0 /100 | #300 | Tragic 6.3% |
Demographics Similar to Laotians by Disability Age 5 to 17
In terms of disability age 5 to 17, the demographic groups most similar to Laotians are Immigrants from Turkey (5.1%, a difference of 0.010%), Paraguayan (5.1%, a difference of 0.040%), Immigrants from Lithuania (5.1%, a difference of 0.070%), Immigrants from Fiji (5.1%, a difference of 0.13%), and Immigrants from Poland (5.1%, a difference of 0.16%).
| Demographics | Rating | Rank | Disability Age 5 to 17 |
| Koreans | 100.0 /100 | #48 | Exceptional 5.1% |
| Immigrants | Western Asia | 100.0 /100 | #49 | Exceptional 5.1% |
| Argentineans | 99.9 /100 | #50 | Exceptional 5.1% |
| Turks | 99.9 /100 | #51 | Exceptional 5.1% |
| Immigrants | Fiji | 99.9 /100 | #52 | Exceptional 5.1% |
| Immigrants | Lithuania | 99.9 /100 | #53 | Exceptional 5.1% |
| Paraguayans | 99.9 /100 | #54 | Exceptional 5.1% |
| Laotians | 99.9 /100 | #55 | Exceptional 5.1% |
| Immigrants | Turkey | 99.9 /100 | #56 | Exceptional 5.1% |
| Immigrants | Poland | 99.9 /100 | #57 | Exceptional 5.1% |
| Immigrants | Ukraine | 99.9 /100 | #58 | Exceptional 5.1% |
| Immigrants | North Macedonia | 99.9 /100 | #59 | Exceptional 5.1% |
| Immigrants | Eastern Europe | 99.9 /100 | #60 | Exceptional 5.1% |
| Immigrants | Switzerland | 99.8 /100 | #61 | Exceptional 5.2% |
| Immigrants | Ireland | 99.8 /100 | #62 | Exceptional 5.2% |