Central American Indian vs Laotian In Labor Force | Age 20-24
COMPARE
Central American Indian
Laotian
In Labor Force | Age 20-24
In Labor Force | Age 20-24 Comparison
Central American Indians
Laotians
72.7%
IN LABOR FORCE | AGE 20-24
0.0/ 100
METRIC RATING
297th/ 347
METRIC RANK
74.1%
IN LABOR FORCE | AGE 20-24
3.5/ 100
METRIC RATING
235th/ 347
METRIC RANK
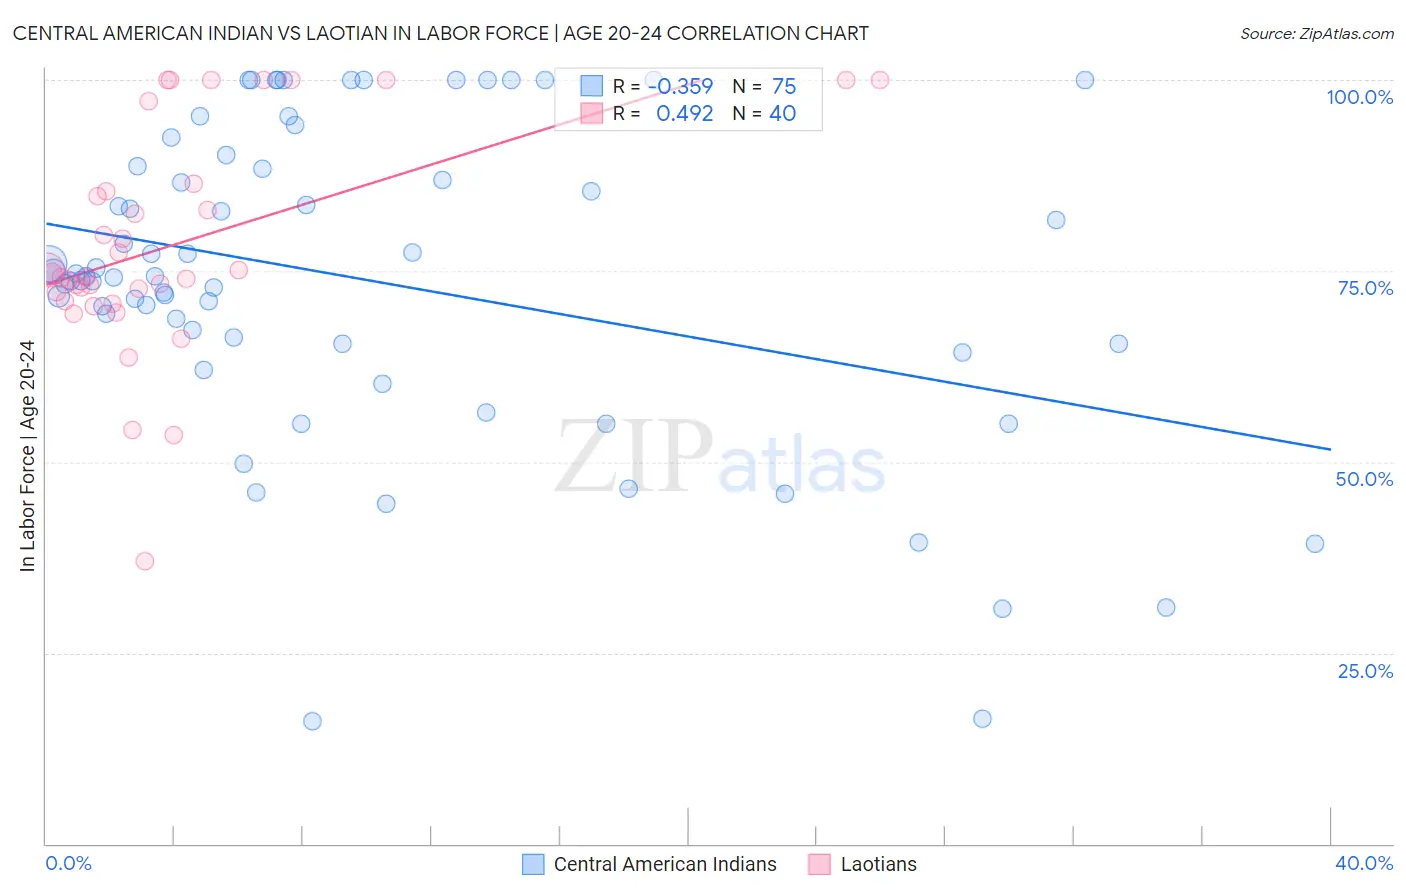
Central American Indian vs Laotian In Labor Force | Age 20-24 Correlation Chart
The statistical analysis conducted on geographies consisting of 326,106,765 people shows a mild negative correlation between the proportion of Central American Indians and labor force participation rate among population between the ages 20 and 24 in the United States with a correlation coefficient (R) of -0.359 and weighted average of 72.7%. Similarly, the statistical analysis conducted on geographies consisting of 224,808,189 people shows a moderate positive correlation between the proportion of Laotians and labor force participation rate among population between the ages 20 and 24 in the United States with a correlation coefficient (R) of 0.492 and weighted average of 74.1%, a difference of 2.0%.
In Labor Force | Age 20-24 Correlation Summary
| Measurement | Central American Indian | Laotian |
| Minimum | 16.0% | 37.0% |
| Maximum | 100.0% | 100.0% |
| Range | 84.0% | 63.0% |
| Mean | 73.8% | 78.5% |
| Median | 74.3% | 74.4% |
| Interquartile 25% (IQ1) | 65.5% | 71.6% |
| Interquartile 75% (IQ3) | 88.7% | 85.9% |
| Interquartile Range (IQR) | 23.2% | 14.3% |
| Standard Deviation (Sample) | 20.4% | 14.5% |
| Standard Deviation (Population) | 20.3% | 14.3% |
Similar Demographics by In Labor Force | Age 20-24
Demographics Similar to Central American Indians by In Labor Force | Age 20-24
In terms of in labor force | age 20-24, the demographic groups most similar to Central American Indians are Okinawan (72.7%, a difference of 0.050%), Jamaican (72.7%, a difference of 0.050%), Israeli (72.6%, a difference of 0.13%), Immigrants from Argentina (72.8%, a difference of 0.16%), and Iranian (72.6%, a difference of 0.17%).
| Demographics | Rating | Rank | In Labor Force | Age 20-24 |
| Immigrants | Belarus | 0.1 /100 | #290 | Tragic 73.0% |
| Immigrants | Nicaragua | 0.0 /100 | #291 | Tragic 72.9% |
| Pueblo | 0.0 /100 | #292 | Tragic 72.9% |
| Immigrants | Belize | 0.0 /100 | #293 | Tragic 72.8% |
| Immigrants | Argentina | 0.0 /100 | #294 | Tragic 72.8% |
| Okinawans | 0.0 /100 | #295 | Tragic 72.7% |
| Jamaicans | 0.0 /100 | #296 | Tragic 72.7% |
| Central American Indians | 0.0 /100 | #297 | Tragic 72.7% |
| Israelis | 0.0 /100 | #298 | Tragic 72.6% |
| Iranians | 0.0 /100 | #299 | Tragic 72.6% |
| Armenians | 0.0 /100 | #300 | Tragic 72.5% |
| Cubans | 0.0 /100 | #301 | Tragic 72.5% |
| Natives/Alaskans | 0.0 /100 | #302 | Tragic 72.4% |
| Ecuadorians | 0.0 /100 | #303 | Tragic 72.4% |
| Immigrants | West Indies | 0.0 /100 | #304 | Tragic 72.4% |
Demographics Similar to Laotians by In Labor Force | Age 20-24
In terms of in labor force | age 20-24, the demographic groups most similar to Laotians are Immigrants (74.1%, a difference of 0.010%), Immigrants from Chile (74.1%, a difference of 0.020%), Immigrants from France (74.1%, a difference of 0.020%), Bermudan (74.1%, a difference of 0.030%), and Immigrants from Switzerland (74.2%, a difference of 0.060%).
| Demographics | Rating | Rank | In Labor Force | Age 20-24 |
| Immigrants | Ukraine | 5.1 /100 | #228 | Tragic 74.2% |
| Immigrants | Sweden | 4.6 /100 | #229 | Tragic 74.2% |
| Immigrants | Albania | 4.3 /100 | #230 | Tragic 74.2% |
| Immigrants | Greece | 4.1 /100 | #231 | Tragic 74.2% |
| Immigrants | Switzerland | 4.1 /100 | #232 | Tragic 74.2% |
| Immigrants | Chile | 3.7 /100 | #233 | Tragic 74.1% |
| Immigrants | Immigrants | 3.6 /100 | #234 | Tragic 74.1% |
| Laotians | 3.5 /100 | #235 | Tragic 74.1% |
| Immigrants | France | 3.3 /100 | #236 | Tragic 74.1% |
| Bermudans | 3.2 /100 | #237 | Tragic 74.1% |
| Immigrants | Japan | 3.0 /100 | #238 | Tragic 74.1% |
| Immigrants | Latin America | 2.7 /100 | #239 | Tragic 74.1% |
| Immigrants | Sri Lanka | 2.3 /100 | #240 | Tragic 74.0% |
| Immigrants | Senegal | 2.1 /100 | #241 | Tragic 74.0% |
| Thais | 2.1 /100 | #242 | Tragic 74.0% |