Central American Indian vs Immigrants from Eritrea Disability Age 65 to 74
COMPARE
Central American Indian
Immigrants from Eritrea
Disability Age 65 to 74
Disability Age 65 to 74 Comparison
Central American Indians
Immigrants from Eritrea
27.1%
DISABILITY AGE 65 TO 74
0.0/ 100
METRIC RATING
302nd/ 347
METRIC RANK
23.4%
DISABILITY AGE 65 TO 74
47.5/ 100
METRIC RATING
176th/ 347
METRIC RANK
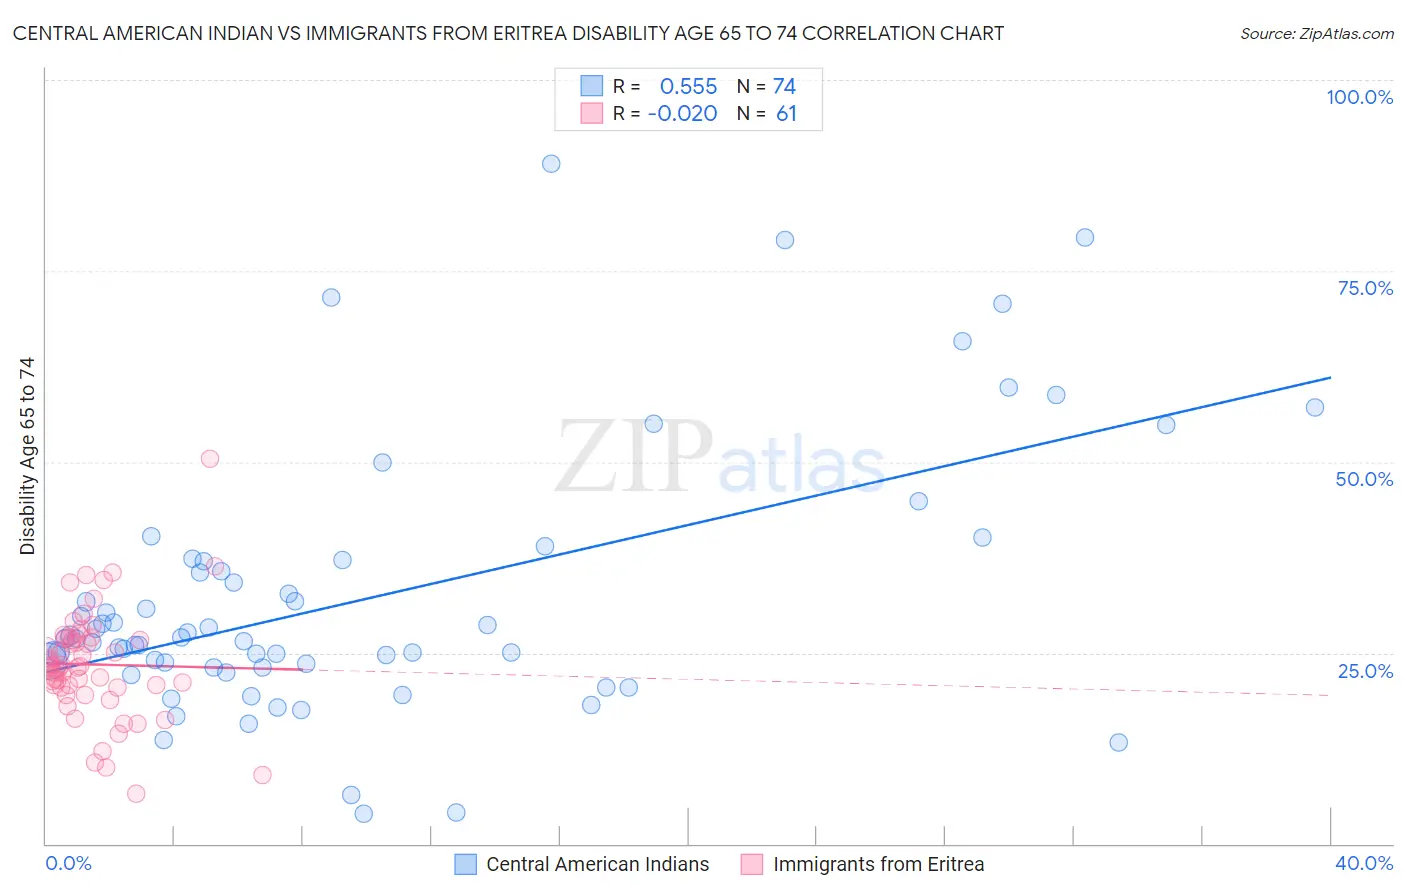
Central American Indian vs Immigrants from Eritrea Disability Age 65 to 74 Correlation Chart
The statistical analysis conducted on geographies consisting of 325,736,526 people shows a substantial positive correlation between the proportion of Central American Indians and percentage of population with a disability between the ages 65 and 75 in the United States with a correlation coefficient (R) of 0.555 and weighted average of 27.1%. Similarly, the statistical analysis conducted on geographies consisting of 104,842,902 people shows no correlation between the proportion of Immigrants from Eritrea and percentage of population with a disability between the ages 65 and 75 in the United States with a correlation coefficient (R) of -0.020 and weighted average of 23.4%, a difference of 16.0%.
Disability Age 65 to 74 Correlation Summary
| Measurement | Central American Indian | Immigrants from Eritrea |
| Minimum | 3.9% | 6.5% |
| Maximum | 89.0% | 50.4% |
| Range | 85.1% | 43.9% |
| Mean | 32.2% | 23.5% |
| Median | 26.9% | 23.1% |
| Interquartile 25% (IQ1) | 23.1% | 20.5% |
| Interquartile 75% (IQ3) | 37.0% | 26.9% |
| Interquartile Range (IQR) | 13.9% | 6.4% |
| Standard Deviation (Sample) | 17.4% | 7.3% |
| Standard Deviation (Population) | 17.2% | 7.2% |
Similar Demographics by Disability Age 65 to 74
Demographics Similar to Central American Indians by Disability Age 65 to 74
In terms of disability age 65 to 74, the demographic groups most similar to Central American Indians are Immigrants from Mexico (27.1%, a difference of 0.010%), Tlingit-Haida (27.1%, a difference of 0.060%), Puget Sound Salish (27.2%, a difference of 0.18%), Mexican (27.2%, a difference of 0.28%), and Immigrants from Dominican Republic (27.0%, a difference of 0.33%).
| Demographics | Rating | Rank | Disability Age 65 to 74 |
| Hispanics or Latinos | 0.0 /100 | #295 | Tragic 26.7% |
| Bangladeshis | 0.0 /100 | #296 | Tragic 26.8% |
| Fijians | 0.0 /100 | #297 | Tragic 27.0% |
| Immigrants | Yemen | 0.0 /100 | #298 | Tragic 27.0% |
| Potawatomi | 0.0 /100 | #299 | Tragic 27.0% |
| Immigrants | Dominican Republic | 0.0 /100 | #300 | Tragic 27.0% |
| Immigrants | Mexico | 0.0 /100 | #301 | Tragic 27.1% |
| Central American Indians | 0.0 /100 | #302 | Tragic 27.1% |
| Tlingit-Haida | 0.0 /100 | #303 | Tragic 27.1% |
| Puget Sound Salish | 0.0 /100 | #304 | Tragic 27.2% |
| Mexicans | 0.0 /100 | #305 | Tragic 27.2% |
| Blacks/African Americans | 0.0 /100 | #306 | Tragic 27.3% |
| Ute | 0.0 /100 | #307 | Tragic 27.3% |
| Sioux | 0.0 /100 | #308 | Tragic 27.3% |
| Yaqui | 0.0 /100 | #309 | Tragic 27.4% |
Demographics Similar to Immigrants from Eritrea by Disability Age 65 to 74
In terms of disability age 65 to 74, the demographic groups most similar to Immigrants from Eritrea are Immigrants from Haiti (23.4%, a difference of 0.0%), Guyanese (23.4%, a difference of 0.10%), Immigrants from Sierra Leone (23.4%, a difference of 0.10%), Dutch (23.3%, a difference of 0.11%), and Scandinavian (23.4%, a difference of 0.12%).
| Demographics | Rating | Rank | Disability Age 65 to 74 |
| Icelanders | 54.3 /100 | #169 | Average 23.3% |
| Moroccans | 54.2 /100 | #170 | Average 23.3% |
| Cubans | 51.9 /100 | #171 | Average 23.3% |
| Germans | 50.5 /100 | #172 | Average 23.3% |
| Yugoslavians | 50.2 /100 | #173 | Average 23.3% |
| Immigrants | South Eastern Asia | 50.0 /100 | #174 | Average 23.3% |
| Dutch | 49.4 /100 | #175 | Average 23.3% |
| Immigrants | Eritrea | 47.5 /100 | #176 | Average 23.4% |
| Immigrants | Haiti | 47.5 /100 | #177 | Average 23.4% |
| Guyanese | 45.8 /100 | #178 | Average 23.4% |
| Immigrants | Sierra Leone | 45.8 /100 | #179 | Average 23.4% |
| Scandinavians | 45.6 /100 | #180 | Average 23.4% |
| Assyrians/Chaldeans/Syriacs | 45.3 /100 | #181 | Average 23.4% |
| Irish | 44.4 /100 | #182 | Average 23.4% |
| Immigrants | Eastern Africa | 42.8 /100 | #183 | Average 23.4% |