Celtic vs Immigrants from Zimbabwe Female Poverty Among 25-34 Year Olds

COMPARE

Celtic
Race
Ancestry
AfghanAfricanAlaska NativeAlaskan AthabascanAlbanianAleutAlsatianAmericanApacheArabArapahoArgentineanArmenianAssyrian/Chaldean/SyriacAustralianAustrianBahamianBangladeshiBarbadianBasqueBelgianBelizeanBermudanBhutaneseBlackfeetBolivianBrazilianBritishBritish West IndianBulgarianBurmeseCajunCambodianCanadianCape VerdeanCarpatho RusynCelticCentral AmericanCentral American IndianCherokeeCheyenneChickasawChileanChineseChippewaChoctawColombianColvilleComancheCosta RicanCreeCreekCroatianCrowCubanCypriotCzechCzechoslovakianDanishDelawareDominicanDutchDutch West IndianEastern EuropeanEcuadorianEgyptianEnglishEstonianEthiopianEuropeanFijianFilipinoFinnishFrenchFrench American IndianFrench CanadianGermanGerman RussianGhanaianGreekGuamanian/ChamorroGuatemalanGuyaneseHaitianHmongHonduranHopiHoumaHungarianIcelanderIndian (Asian)IndonesianInupiatIranianIraqiIrishIroquoisIsraeliItalianJamaicanJapaneseJordanianKenyanKiowaKoreanLaotianLatvianLebaneseLiberianLithuanianLumbeeLuxembourgerMacedonianMalaysianMalteseMarshalleseMenomineeMexicanMexican American IndianMongolianMoroccanNative HawaiianNavajoNepaleseNew ZealanderNicaraguanNigerianNorthern EuropeanNorwegianOkinawanOsageOttawaPaiutePakistaniPalestinianPanamanianParaguayanPennsylvania GermanPeruvianPimaPolishPortuguesePotawatomiPuebloPuerto RicanPuget Sound SalishRomanianRussianSalvadoranSamoanScandinavianScotch-IrishScottishSeminoleSenegaleseSerbianShoshoneSierra LeoneanSiouxSlavicSlovakSloveneSomaliSouth AfricanSouth AmericanSouth American IndianSoviet UnionSpaniardSpanishSpanish AmericanSpanish American IndianSri LankanSubsaharan AfricanSudaneseSwedishSwissSyrianTaiwaneseThaiTlingit-HaidaTohono O'OdhamTonganTrinidadian and TobagonianTsimshianTurkishU.S. Virgin IslanderUgandanUkrainianUruguayanUteVenezuelanVietnameseWelshWest IndianYakamaYaquiYugoslavianYumanYup'ikZimbabwean
Immigration
NonimmigrantsImmigrantsAfghanistanAfricaAlbaniaArgentinaArmeniaAsiaAustraliaAustriaBahamasBangladeshBarbadosBelarusBelgiumBelizeBoliviaBosnia and HerzegovinaBrazilBulgariaBurma/MyanmarCabo VerdeCambodiaCameroonCanadaCaribbeanCentral AmericaChileChinaColombiaCongoCosta RicaCroatiaCubaCzechoslovakiaDenmarkDominicaDominican RepublicEastern AfricaEastern AsiaEastern EuropeEcuadorEgyptEl SalvadorEnglandEritreaEthiopiaEuropeFijiFranceGermanyGhanaGreeceGrenadaGuatemalaGuyanaHaitiHondurasHong KongHungaryIndiaIndonesiaIranIraqIrelandIsraelItalyJamaicaJapanJordanKazakhstanKenyaKoreaKuwaitLaosLatin AmericaLatviaLebanonLiberiaLithuaniaMalaysiaMexicoMicronesiaMiddle AfricaMoldovaMoroccoNepalNetherlandsNicaraguaNigeriaNorth AmericaNorth MacedoniaNorthern AfricaNorthern EuropeNorwayOceaniaPakistanPanamaPeruPhilippinesPolandPortugalRomaniaRussiaSaudi ArabiaScotlandSenegalSerbiaSierra LeoneSingaporeSomaliaSouth AfricaSouth AmericaSouth Central AsiaSouth Eastern AsiaSouthern EuropeSpainSri LankaSt. Vincent and the GrenadinesSudanSwedenSwitzerlandSyriaTaiwanThailandTrinidad and TobagoTurkeyUgandaUkraineUruguayUzbekistanVenezuelaVietnamWest IndiesWestern AfricaWestern AsiaWestern EuropeYemenZaireAzores
Immigrants from Zimbabwe
Race
Ancestry
AfghanAfricanAlaska NativeAlaskan AthabascanAlbanianAleutAlsatianAmericanApacheArabArapahoArgentineanArmenianAssyrian/Chaldean/SyriacAustralianAustrianBahamianBangladeshiBarbadianBasqueBelgianBelizeanBermudanBhutaneseBlackfeetBolivianBrazilianBritishBritish West IndianBulgarianBurmeseCajunCambodianCanadianCape VerdeanCarpatho RusynCentral AmericanCentral American IndianCherokeeCheyenneChickasawChileanChineseChippewaChoctawColombianColvilleComancheCosta RicanCreeCreekCroatianCrowCubanCypriotCzechCzechoslovakianDanishDelawareDominicanDutchDutch West IndianEastern EuropeanEcuadorianEgyptianEnglishEstonianEthiopianEuropeanFijianFilipinoFinnishFrenchFrench American IndianFrench CanadianGermanGerman RussianGhanaianGreekGuamanian/ChamorroGuatemalanGuyaneseHaitianHmongHonduranHopiHoumaHungarianIcelanderIndian (Asian)IndonesianInupiatIranianIraqiIrishIroquoisIsraeliItalianJamaicanJapaneseJordanianKenyanKiowaKoreanLaotianLatvianLebaneseLiberianLithuanianLumbeeLuxembourgerMacedonianMalaysianMalteseMarshalleseMenomineeMexicanMexican American IndianMongolianMoroccanNative HawaiianNavajoNepaleseNew ZealanderNicaraguanNigerianNorthern EuropeanNorwegianOkinawanOsageOttawaPaiutePakistaniPalestinianPanamanianParaguayanPennsylvania GermanPeruvianPimaPolishPortuguesePotawatomiPuebloPuerto RicanPuget Sound SalishRomanianRussianSalvadoranSamoanScandinavianScotch-IrishScottishSeminoleSenegaleseSerbianShoshoneSierra LeoneanSiouxSlavicSlovakSloveneSomaliSouth AfricanSouth AmericanSouth American IndianSoviet UnionSpaniardSpanishSpanish AmericanSpanish American IndianSri LankanSubsaharan AfricanSudaneseSwedishSwissSyrianTaiwaneseThaiTlingit-HaidaTohono O'OdhamTonganTrinidadian and TobagonianTsimshianTurkishU.S. Virgin IslanderUgandanUkrainianUruguayanUteVenezuelanVietnameseWelshWest IndianYakamaYaquiYugoslavianYumanYup'ikZimbabwean
Immigration
NonimmigrantsImmigrantsAfghanistanAfricaAlbaniaArgentinaArmeniaAsiaAustraliaAustriaBahamasBangladeshBarbadosBelarusBelgiumBelizeBoliviaBosnia and HerzegovinaBrazilBulgariaBurma/MyanmarCabo VerdeCambodiaCameroonCanadaCaribbeanCentral AmericaChileChinaColombiaCongoCosta RicaCroatiaCubaCzechoslovakiaDenmarkDominicaDominican RepublicEastern AfricaEastern AsiaEastern EuropeEcuadorEgyptEl SalvadorEnglandEritreaEthiopiaEuropeFijiFranceGermanyGhanaGreeceGrenadaGuatemalaGuyanaHaitiHondurasHong KongHungaryIndiaIndonesiaIranIraqIrelandIsraelItalyJamaicaJapanJordanKazakhstanKenyaKoreaKuwaitLaosLatin AmericaLatviaLebanonLiberiaLithuaniaMalaysiaMexicoMicronesiaMiddle AfricaMoldovaMoroccoNepalNetherlandsNicaraguaNigeriaNorth AmericaNorth MacedoniaNorthern AfricaNorthern EuropeNorwayOceaniaPakistanPanamaPeruPhilippinesPolandPortugalRomaniaRussiaSaudi ArabiaScotlandSenegalSerbiaSierra LeoneSingaporeSomaliaSouth AfricaSouth AmericaSouth Central AsiaSouth Eastern AsiaSouthern EuropeSpainSri LankaSt. Vincent and the GrenadinesSudanSwedenSwitzerlandSyriaTaiwanThailandTrinidad and TobagoTurkeyUgandaUkraineUruguayUzbekistanVenezuelaVietnamWest IndiesWestern AfricaWestern AsiaWestern EuropeYemenZaireZimbabweAzores
Female Poverty Among 25-34 Year Olds
Income
Poverty
Unemployment
Labor Participation
Family Structure
Vehicle Availability
Education Level
Disability

Female Poverty Among 25-34 Year Olds Comparison

Celtics

Immigrants from Zimbabwe

Tragic
Exceptional
14.5%
FEMALE POVERTY AMONG 25-34 YEAR OLDS
2.8/ 100
METRIC RATING
227th/ 347
METRIC RANK
12.6%
FEMALE POVERTY AMONG 25-34 YEAR OLDS
96.7/ 100
METRIC RATING
96th/ 347
METRIC RANK

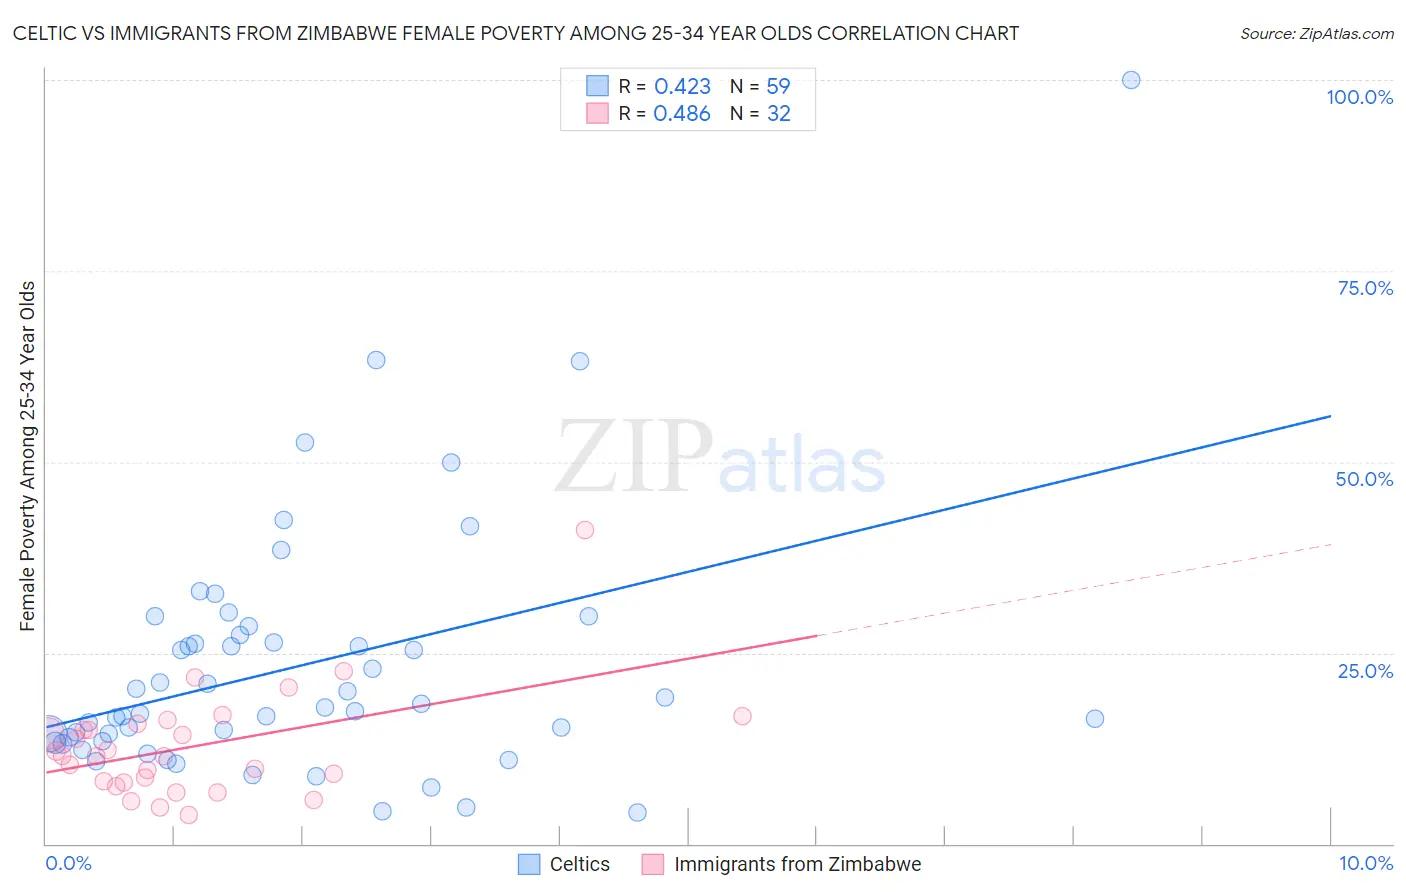
Celtic vs Immigrants from Zimbabwe Female Poverty Among 25-34 Year Olds Correlation Chart

The statistical analysis conducted on geographies consisting of 167,503,156 people shows a moderate positive correlation between the proportion of Celtics and poverty level among females between the ages 25 and 34 in the United States with a correlation coefficient (R) of 0.423 and weighted average of 14.5%. Similarly, the statistical analysis conducted on geographies consisting of 117,339,985 people shows a moderate positive correlation between the proportion of Immigrants from Zimbabwe and poverty level among females between the ages 25 and 34 in the United States with a correlation coefficient (R) of 0.486 and weighted average of 12.6%, a difference of 15.5%.
Celtic vs Immigrants from Zimbabwe Female Poverty Among 25-34 Year Olds

Female Poverty Among 25-34 Year Olds Correlation Summary

MeasurementCelticImmigrants from Zimbabwe
Minimum4.1%3.8%
Maximum100.0%41.1%
Range95.9%37.4%
Mean23.2%12.7%
Median17.8%11.5%
Interquartile 25% (IQ1)13.4%8.1%
Interquartile 75% (IQ3)27.3%15.3%
Interquartile Range (IQR)13.9%7.2%
Standard Deviation (Sample)16.5%7.1%
Standard Deviation (Population)16.4%7.0%

Similar Demographics by Female Poverty Among 25-34 Year Olds

Demographics Similar to Celtics by Female Poverty Among 25-34 Year Olds

In terms of female poverty among 25-34 year olds, the demographic groups most similar to Celtics are Vietnamese (14.6%, a difference of 0.17%), Spanish (14.6%, a difference of 0.27%), Nicaraguan (14.5%, a difference of 0.30%), Immigrants from Barbados (14.5%, a difference of 0.38%), and Spaniard (14.6%, a difference of 0.41%).
DemographicsRating | RankFemale Poverty Among 25-34 Year Olds
Ghanaians
4.8
/100
|
#220
Tragic
14.4%
Sudanese
4.4
/100
|
#221
Tragic
14.4%
Immigrants | Portugal
4.3
/100
|
#222
Tragic
14.4%
Nigerians
4.2
/100
|
#223
Tragic
14.4%
Immigrants | Sudan
4.0
/100
|
#224
Tragic
14.4%
Immigrants | Barbados
3.4
/100
|
#225
Tragic
14.5%
Nicaraguans
3.3
/100
|
#226
Tragic
14.5%
Celtics
2.8
/100
|
#227
Tragic
14.5%
Vietnamese
2.6
/100
|
#228
Tragic
14.6%
Spanish
2.5
/100
|
#229
Tragic
14.6%
Spaniards
2.3
/100
|
#230
Tragic
14.6%
Delaware
2.3
/100
|
#231
Tragic
14.6%
Immigrants | Ecuador
1.9
/100
|
#232
Tragic
14.6%
Whites/Caucasians
1.8
/100
|
#233
Tragic
14.7%
Cubans
1.6
/100
|
#234
Tragic
14.7%

Demographics Similar to Immigrants from Zimbabwe by Female Poverty Among 25-34 Year Olds

In terms of female poverty among 25-34 year olds, the demographic groups most similar to Immigrants from Zimbabwe are Ukrainian (12.6%, a difference of 0.010%), Immigrants from France (12.6%, a difference of 0.050%), Palestinian (12.6%, a difference of 0.10%), Immigrants from Northern Africa (12.6%, a difference of 0.12%), and Immigrants from Ethiopia (12.6%, a difference of 0.12%).
DemographicsRating | RankFemale Poverty Among 25-34 Year Olds
Italians
97.2
/100
|
#89
Exceptional
12.5%
Immigrants | Albania
97.1
/100
|
#90
Exceptional
12.5%
Norwegians
96.9
/100
|
#91
Exceptional
12.6%
Immigrants | Armenia
96.9
/100
|
#92
Exceptional
12.6%
Palestinians
96.9
/100
|
#93
Exceptional
12.6%
Immigrants | France
96.8
/100
|
#94
Exceptional
12.6%
Ukrainians
96.7
/100
|
#95
Exceptional
12.6%
Immigrants | Zimbabwe
96.7
/100
|
#96
Exceptional
12.6%
Immigrants | Northern Africa
96.6
/100
|
#97
Exceptional
12.6%
Immigrants | Ethiopia
96.5
/100
|
#98
Exceptional
12.6%
Immigrants | Argentina
96.4
/100
|
#99
Exceptional
12.6%
Immigrants | Denmark
95.7
/100
|
#100
Exceptional
12.7%
Immigrants | Switzerland
95.7
/100
|
#101
Exceptional
12.7%
Peruvians
95.6
/100
|
#102
Exceptional
12.7%
Immigrants | Spain
95.5
/100
|
#103
Exceptional
12.7%