Celtic vs French Vision Disability
COMPARE
Celtic
French
Vision Disability
Vision Disability Comparison
Celtics
French
2.4%
VISION DISABILITY
0.1/ 100
METRIC RATING
269th/ 347
METRIC RANK
2.3%
VISION DISABILITY
0.5/ 100
METRIC RATING
246th/ 347
METRIC RANK
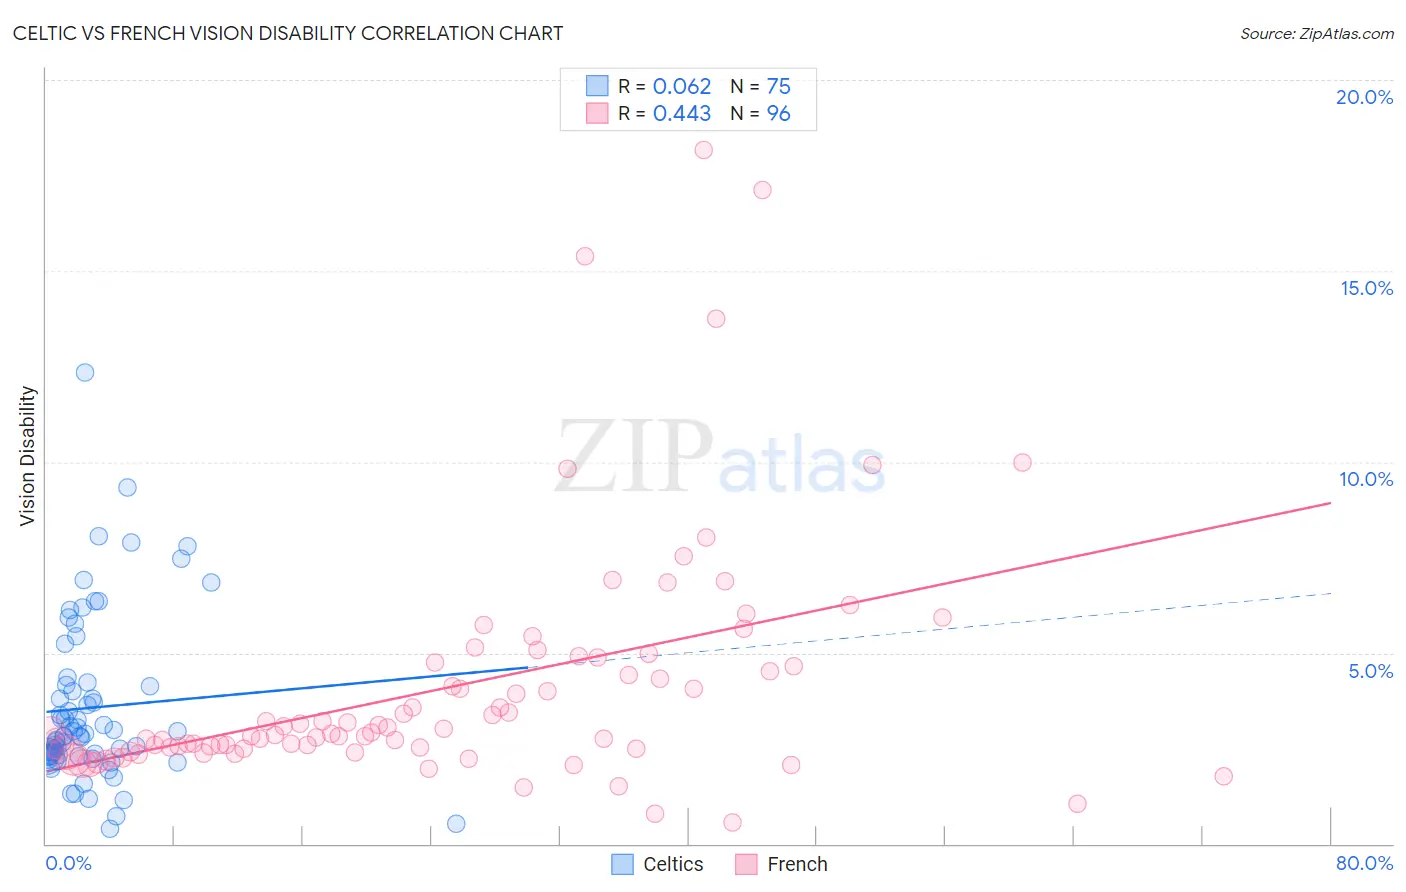
Celtic vs French Vision Disability Correlation Chart
The statistical analysis conducted on geographies consisting of 168,807,792 people shows a slight positive correlation between the proportion of Celtics and percentage of population with vision disability in the United States with a correlation coefficient (R) of 0.062 and weighted average of 2.4%. Similarly, the statistical analysis conducted on geographies consisting of 570,344,366 people shows a moderate positive correlation between the proportion of French and percentage of population with vision disability in the United States with a correlation coefficient (R) of 0.443 and weighted average of 2.3%, a difference of 2.7%.
Vision Disability Correlation Summary
| Measurement | Celtic | French |
| Minimum | 0.40% | 0.55% |
| Maximum | 12.3% | 18.2% |
| Range | 11.9% | 17.6% |
| Mean | 3.6% | 4.1% |
| Median | 2.8% | 2.9% |
| Interquartile 25% (IQ1) | 2.3% | 2.5% |
| Interquartile 75% (IQ3) | 4.2% | 4.7% |
| Interquartile Range (IQR) | 1.9% | 2.2% |
| Standard Deviation (Sample) | 2.2% | 3.1% |
| Standard Deviation (Population) | 2.2% | 3.1% |
Similar Demographics by Vision Disability
Demographics Similar to Celtics by Vision Disability
In terms of vision disability, the demographic groups most similar to Celtics are Cuban (2.4%, a difference of 0.010%), Immigrants from the Azores (2.4%, a difference of 0.16%), Senegalese (2.4%, a difference of 0.27%), Spaniard (2.4%, a difference of 0.27%), and Ute (2.4%, a difference of 0.36%).
| Demographics | Rating | Rank | Vision Disability |
| Jamaicans | 0.1 /100 | #262 | Tragic 2.4% |
| Immigrants | Belize | 0.1 /100 | #263 | Tragic 2.4% |
| Immigrants | Liberia | 0.1 /100 | #264 | Tragic 2.4% |
| Immigrants | Jamaica | 0.1 /100 | #265 | Tragic 2.4% |
| Mexican American Indians | 0.1 /100 | #266 | Tragic 2.4% |
| Ute | 0.1 /100 | #267 | Tragic 2.4% |
| Senegalese | 0.1 /100 | #268 | Tragic 2.4% |
| Celtics | 0.1 /100 | #269 | Tragic 2.4% |
| Cubans | 0.1 /100 | #270 | Tragic 2.4% |
| Immigrants | Azores | 0.1 /100 | #271 | Tragic 2.4% |
| Spaniards | 0.1 /100 | #272 | Tragic 2.4% |
| Immigrants | Bahamas | 0.1 /100 | #273 | Tragic 2.4% |
| Immigrants | Latin America | 0.0 /100 | #274 | Tragic 2.4% |
| Chippewa | 0.0 /100 | #275 | Tragic 2.4% |
| Scotch-Irish | 0.0 /100 | #276 | Tragic 2.4% |
Demographics Similar to French by Vision Disability
In terms of vision disability, the demographic groups most similar to French are Guatemalan (2.3%, a difference of 0.040%), Subsaharan African (2.3%, a difference of 0.060%), Liberian (2.3%, a difference of 0.070%), Alsatian (2.3%, a difference of 0.15%), and Bangladeshi (2.3%, a difference of 0.15%).
| Demographics | Rating | Rank | Vision Disability |
| English | 1.1 /100 | #239 | Tragic 2.3% |
| Panamanians | 0.9 /100 | #240 | Tragic 2.3% |
| Malaysians | 0.9 /100 | #241 | Tragic 2.3% |
| Immigrants | Panama | 0.8 /100 | #242 | Tragic 2.3% |
| Immigrants | Nicaragua | 0.6 /100 | #243 | Tragic 2.3% |
| Immigrants | West Indies | 0.6 /100 | #244 | Tragic 2.3% |
| Alsatians | 0.6 /100 | #245 | Tragic 2.3% |
| French | 0.5 /100 | #246 | Tragic 2.3% |
| Guatemalans | 0.5 /100 | #247 | Tragic 2.3% |
| Sub-Saharan Africans | 0.5 /100 | #248 | Tragic 2.3% |
| Liberians | 0.5 /100 | #249 | Tragic 2.3% |
| Bangladeshis | 0.5 /100 | #250 | Tragic 2.3% |
| Immigrants | Laos | 0.4 /100 | #251 | Tragic 2.4% |
| Immigrants | Micronesia | 0.3 /100 | #252 | Tragic 2.4% |
| Japanese | 0.3 /100 | #253 | Tragic 2.4% |