Pueblo vs Immigrants from India Hearing Disability
COMPARE
Pueblo
Immigrants from India
Hearing Disability
Hearing Disability Comparison
Pueblo
Immigrants from India
4.6%
HEARING DISABILITY
0.0/ 100
METRIC RATING
340th/ 347
METRIC RANK
2.5%
HEARING DISABILITY
99.9/ 100
METRIC RATING
17th/ 347
METRIC RANK
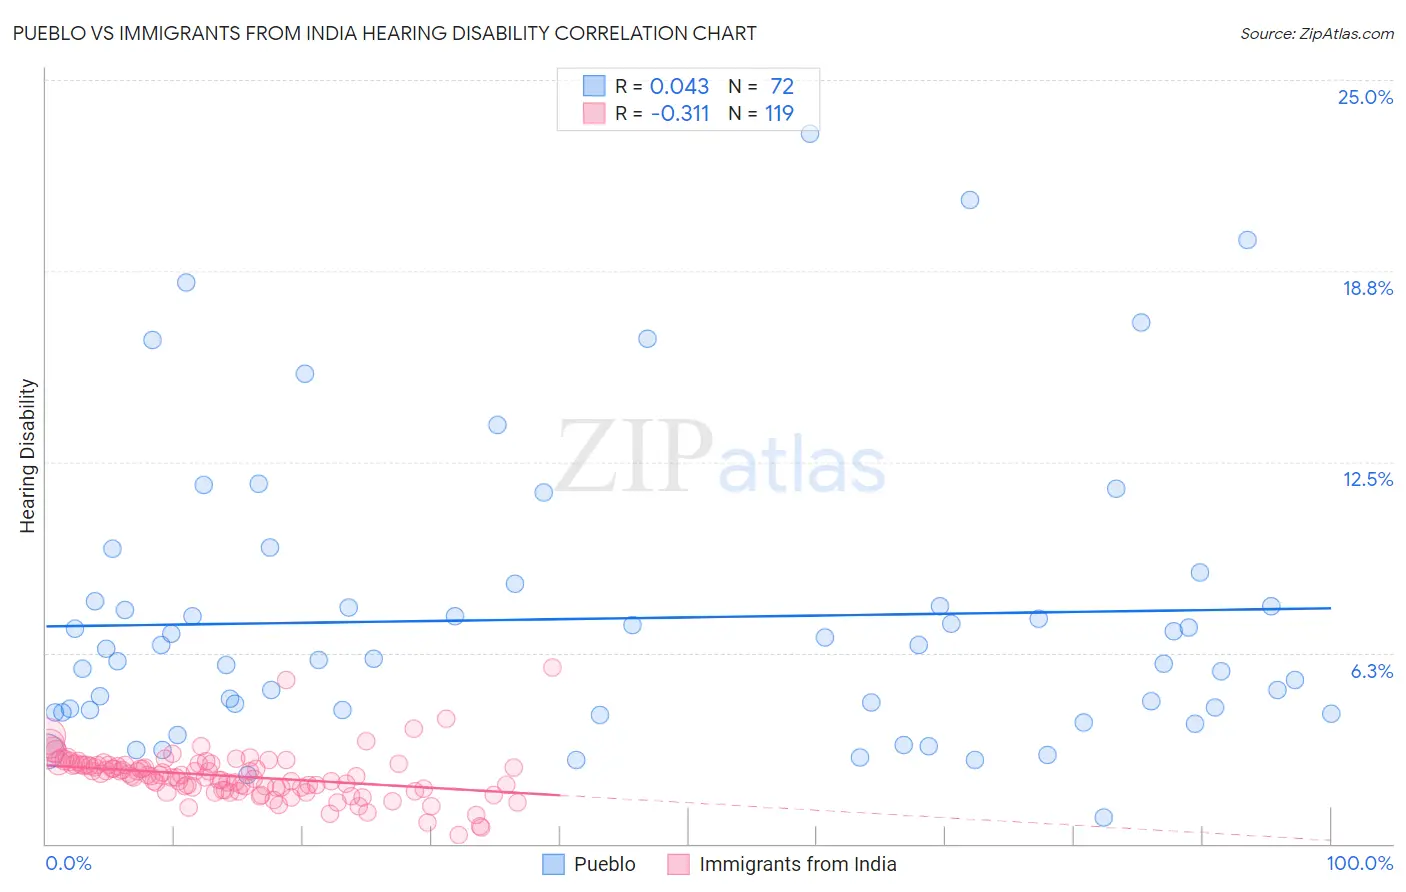
Pueblo vs Immigrants from India Hearing Disability Correlation Chart
The statistical analysis conducted on geographies consisting of 120,073,989 people shows no correlation between the proportion of Pueblo and percentage of population with hearing disability in the United States with a correlation coefficient (R) of 0.043 and weighted average of 4.6%. Similarly, the statistical analysis conducted on geographies consisting of 433,914,336 people shows a mild negative correlation between the proportion of Immigrants from India and percentage of population with hearing disability in the United States with a correlation coefficient (R) of -0.311 and weighted average of 2.5%, a difference of 82.6%.
Hearing Disability Correlation Summary
| Measurement | Pueblo | Immigrants from India |
| Minimum | 0.85% | 0.30% |
| Maximum | 23.2% | 5.8% |
| Range | 22.4% | 5.5% |
| Mean | 7.4% | 2.2% |
| Median | 6.0% | 2.2% |
| Interquartile 25% (IQ1) | 4.3% | 1.8% |
| Interquartile 75% (IQ3) | 7.8% | 2.6% |
| Interquartile Range (IQR) | 3.5% | 0.78% |
| Standard Deviation (Sample) | 4.7% | 0.78% |
| Standard Deviation (Population) | 4.7% | 0.77% |
Similar Demographics by Hearing Disability
Demographics Similar to Pueblo by Hearing Disability
In terms of hearing disability, the demographic groups most similar to Pueblo are Navajo (4.6%, a difference of 0.33%), Choctaw (4.5%, a difference of 1.5%), Tsimshian (4.7%, a difference of 1.9%), Inupiat (4.7%, a difference of 2.1%), and Alaska Native (4.5%, a difference of 2.9%).
| Demographics | Rating | Rank | Hearing Disability |
| Dutch West Indians | 0.0 /100 | #333 | Tragic 4.3% |
| Aleuts | 0.0 /100 | #334 | Tragic 4.3% |
| Kiowa | 0.0 /100 | #335 | Tragic 4.3% |
| Creek | 0.0 /100 | #336 | Tragic 4.4% |
| Chickasaw | 0.0 /100 | #337 | Tragic 4.5% |
| Alaska Natives | 0.0 /100 | #338 | Tragic 4.5% |
| Choctaw | 0.0 /100 | #339 | Tragic 4.5% |
| Pueblo | 0.0 /100 | #340 | Tragic 4.6% |
| Navajo | 0.0 /100 | #341 | Tragic 4.6% |
| Tsimshian | 0.0 /100 | #342 | Tragic 4.7% |
| Inupiat | 0.0 /100 | #343 | Tragic 4.7% |
| Tlingit-Haida | 0.0 /100 | #344 | Tragic 4.8% |
| Alaskan Athabascans | 0.0 /100 | #345 | Tragic 5.3% |
| Colville | 0.0 /100 | #346 | Tragic 5.3% |
| Yup'ik | 0.0 /100 | #347 | Tragic 5.8% |
Demographics Similar to Immigrants from India by Hearing Disability
In terms of hearing disability, the demographic groups most similar to Immigrants from India are Immigrants from West Indies (2.5%, a difference of 0.32%), Barbadian (2.5%, a difference of 0.47%), Dominican (2.5%, a difference of 0.69%), Thai (2.5%, a difference of 0.72%), and Ecuadorian (2.5%, a difference of 0.77%).
| Demographics | Rating | Rank | Hearing Disability |
| Immigrants | Ecuador | 99.9 /100 | #10 | Exceptional 2.5% |
| Immigrants | Trinidad and Tobago | 99.9 /100 | #11 | Exceptional 2.5% |
| Trinidadians and Tobagonians | 99.9 /100 | #12 | Exceptional 2.5% |
| Sierra Leoneans | 99.9 /100 | #13 | Exceptional 2.5% |
| Ecuadorians | 99.9 /100 | #14 | Exceptional 2.5% |
| Barbadians | 99.9 /100 | #15 | Exceptional 2.5% |
| Immigrants | West Indies | 99.9 /100 | #16 | Exceptional 2.5% |
| Immigrants | India | 99.9 /100 | #17 | Exceptional 2.5% |
| Dominicans | 99.8 /100 | #18 | Exceptional 2.5% |
| Thais | 99.8 /100 | #19 | Exceptional 2.5% |
| Immigrants | Bolivia | 99.8 /100 | #20 | Exceptional 2.5% |
| Ghanaians | 99.8 /100 | #21 | Exceptional 2.5% |
| Immigrants | Sierra Leone | 99.8 /100 | #22 | Exceptional 2.6% |
| Immigrants | Nigeria | 99.8 /100 | #23 | Exceptional 2.6% |
| Immigrants | Ghana | 99.8 /100 | #24 | Exceptional 2.6% |