Argentinean vs Immigrants from India Hearing Disability
COMPARE
Argentinean
Immigrants from India
Hearing Disability
Hearing Disability Comparison
Argentineans
Immigrants from India
2.7%
HEARING DISABILITY
97.5/ 100
METRIC RATING
73rd/ 347
METRIC RANK
2.5%
HEARING DISABILITY
99.9/ 100
METRIC RATING
17th/ 347
METRIC RANK
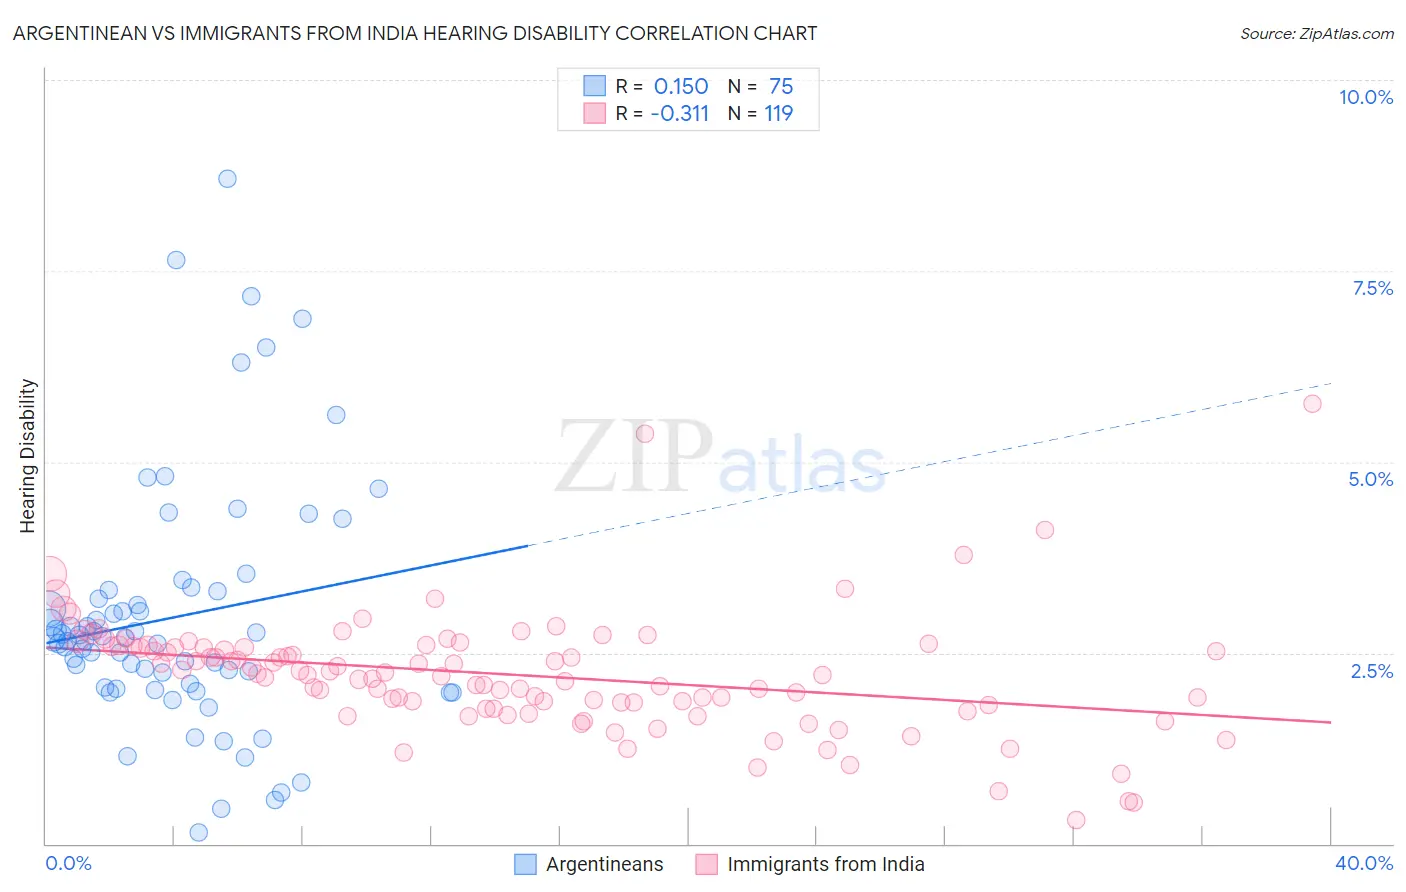
Argentinean vs Immigrants from India Hearing Disability Correlation Chart
The statistical analysis conducted on geographies consisting of 297,082,956 people shows a poor positive correlation between the proportion of Argentineans and percentage of population with hearing disability in the United States with a correlation coefficient (R) of 0.150 and weighted average of 2.7%. Similarly, the statistical analysis conducted on geographies consisting of 433,914,336 people shows a mild negative correlation between the proportion of Immigrants from India and percentage of population with hearing disability in the United States with a correlation coefficient (R) of -0.311 and weighted average of 2.5%, a difference of 8.2%.
Hearing Disability Correlation Summary
| Measurement | Argentinean | Immigrants from India |
| Minimum | 0.15% | 0.30% |
| Maximum | 8.7% | 5.8% |
| Range | 8.6% | 5.5% |
| Mean | 3.0% | 2.2% |
| Median | 2.7% | 2.2% |
| Interquartile 25% (IQ1) | 2.0% | 1.8% |
| Interquartile 75% (IQ3) | 3.3% | 2.6% |
| Interquartile Range (IQR) | 1.3% | 0.78% |
| Standard Deviation (Sample) | 1.6% | 0.78% |
| Standard Deviation (Population) | 1.6% | 0.77% |
Similar Demographics by Hearing Disability
Demographics Similar to Argentineans by Hearing Disability
In terms of hearing disability, the demographic groups most similar to Argentineans are Immigrants from Korea (2.7%, a difference of 0.0%), Immigrants from Saudi Arabia (2.7%, a difference of 0.030%), Asian (2.7%, a difference of 0.030%), Immigrants from Malaysia (2.7%, a difference of 0.060%), and Afghan (2.7%, a difference of 0.080%).
| Demographics | Rating | Rank | Hearing Disability |
| Immigrants | Belize | 98.2 /100 | #66 | Exceptional 2.7% |
| Egyptians | 98.1 /100 | #67 | Exceptional 2.7% |
| Immigrants | Africa | 98.0 /100 | #68 | Exceptional 2.7% |
| Nicaraguans | 97.9 /100 | #69 | Exceptional 2.7% |
| Peruvians | 97.7 /100 | #70 | Exceptional 2.7% |
| Central Americans | 97.7 /100 | #71 | Exceptional 2.7% |
| Afghans | 97.6 /100 | #72 | Exceptional 2.7% |
| Argentineans | 97.5 /100 | #73 | Exceptional 2.7% |
| Immigrants | Korea | 97.5 /100 | #74 | Exceptional 2.7% |
| Immigrants | Saudi Arabia | 97.5 /100 | #75 | Exceptional 2.7% |
| Asians | 97.5 /100 | #76 | Exceptional 2.7% |
| Immigrants | Malaysia | 97.5 /100 | #77 | Exceptional 2.7% |
| Mongolians | 97.4 /100 | #78 | Exceptional 2.7% |
| Colombians | 97.4 /100 | #79 | Exceptional 2.7% |
| Immigrants | Asia | 97.2 /100 | #80 | Exceptional 2.7% |
Demographics Similar to Immigrants from India by Hearing Disability
In terms of hearing disability, the demographic groups most similar to Immigrants from India are Immigrants from West Indies (2.5%, a difference of 0.32%), Barbadian (2.5%, a difference of 0.47%), Dominican (2.5%, a difference of 0.69%), Thai (2.5%, a difference of 0.72%), and Ecuadorian (2.5%, a difference of 0.77%).
| Demographics | Rating | Rank | Hearing Disability |
| Immigrants | Ecuador | 99.9 /100 | #10 | Exceptional 2.5% |
| Immigrants | Trinidad and Tobago | 99.9 /100 | #11 | Exceptional 2.5% |
| Trinidadians and Tobagonians | 99.9 /100 | #12 | Exceptional 2.5% |
| Sierra Leoneans | 99.9 /100 | #13 | Exceptional 2.5% |
| Ecuadorians | 99.9 /100 | #14 | Exceptional 2.5% |
| Barbadians | 99.9 /100 | #15 | Exceptional 2.5% |
| Immigrants | West Indies | 99.9 /100 | #16 | Exceptional 2.5% |
| Immigrants | India | 99.9 /100 | #17 | Exceptional 2.5% |
| Dominicans | 99.8 /100 | #18 | Exceptional 2.5% |
| Thais | 99.8 /100 | #19 | Exceptional 2.5% |
| Immigrants | Bolivia | 99.8 /100 | #20 | Exceptional 2.5% |
| Ghanaians | 99.8 /100 | #21 | Exceptional 2.5% |
| Immigrants | Sierra Leone | 99.8 /100 | #22 | Exceptional 2.6% |
| Immigrants | Nigeria | 99.8 /100 | #23 | Exceptional 2.6% |
| Immigrants | Ghana | 99.8 /100 | #24 | Exceptional 2.6% |