Carpatho Rusyn vs Peruvian Cognitive Disability
COMPARE
Carpatho Rusyn
Peruvian
Cognitive Disability
Cognitive Disability Comparison
Carpatho Rusyns
Peruvians
17.0%
COGNITIVE DISABILITY
89.6/ 100
METRIC RATING
142nd/ 347
METRIC RANK
16.7%
COGNITIVE DISABILITY
99.3/ 100
METRIC RATING
78th/ 347
METRIC RANK
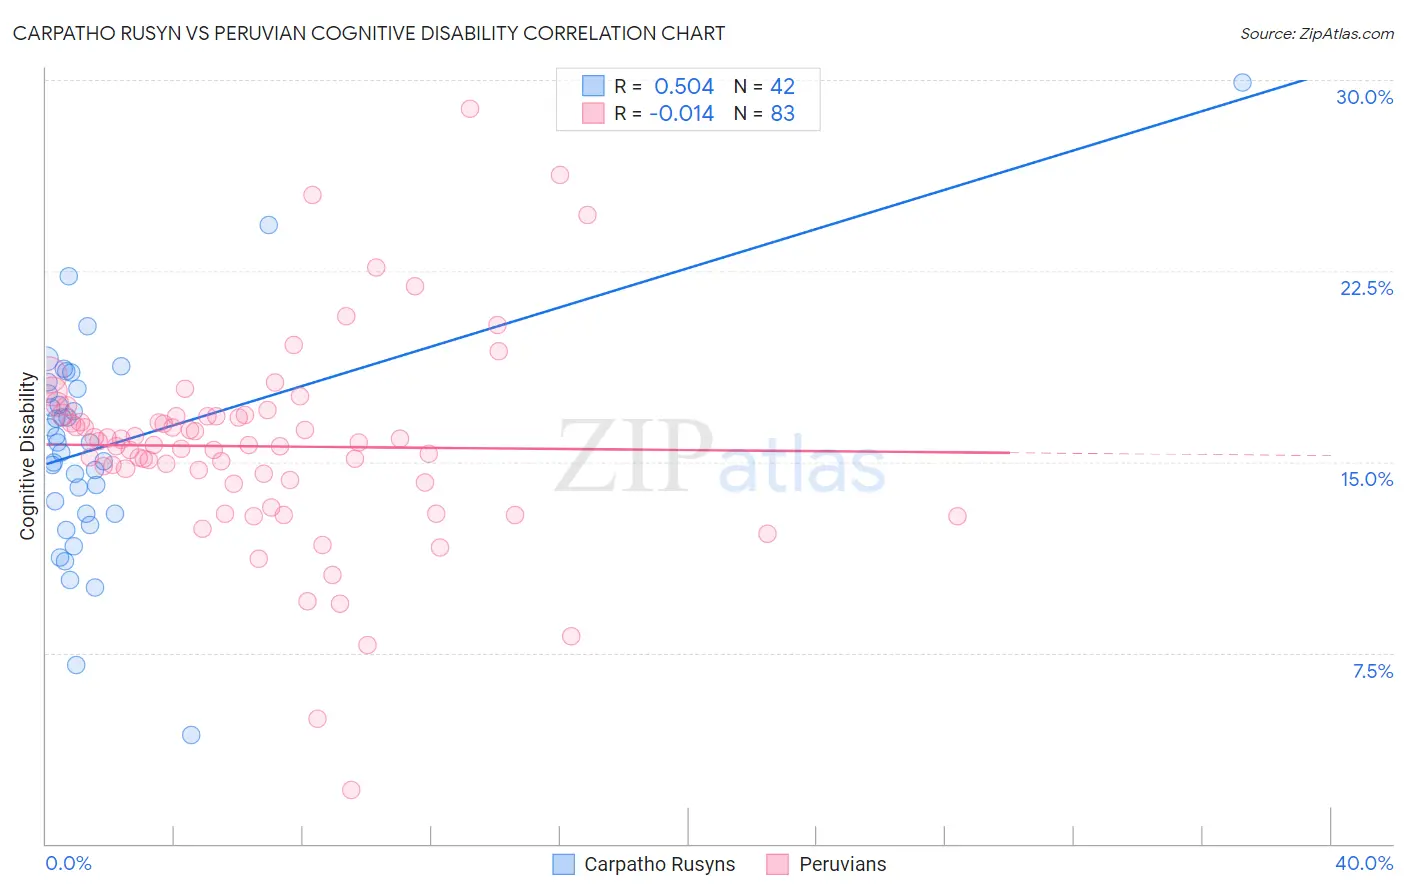
Carpatho Rusyn vs Peruvian Cognitive Disability Correlation Chart
The statistical analysis conducted on geographies consisting of 58,872,415 people shows a substantial positive correlation between the proportion of Carpatho Rusyns and percentage of population with cognitive disability in the United States with a correlation coefficient (R) of 0.504 and weighted average of 17.0%. Similarly, the statistical analysis conducted on geographies consisting of 363,189,902 people shows no correlation between the proportion of Peruvians and percentage of population with cognitive disability in the United States with a correlation coefficient (R) of -0.014 and weighted average of 16.7%, a difference of 2.0%.
Cognitive Disability Correlation Summary
| Measurement | Carpatho Rusyn | Peruvian |
| Minimum | 4.3% | 2.1% |
| Maximum | 29.9% | 28.9% |
| Range | 25.6% | 26.8% |
| Mean | 15.6% | 15.6% |
| Median | 15.8% | 15.7% |
| Interquartile 25% (IQ1) | 13.0% | 14.2% |
| Interquartile 75% (IQ3) | 17.9% | 16.8% |
| Interquartile Range (IQR) | 4.9% | 2.6% |
| Standard Deviation (Sample) | 4.4% | 4.0% |
| Standard Deviation (Population) | 4.3% | 4.0% |
Similar Demographics by Cognitive Disability
Demographics Similar to Carpatho Rusyns by Cognitive Disability
In terms of cognitive disability, the demographic groups most similar to Carpatho Rusyns are Aleut (17.0%, a difference of 0.020%), British (17.0%, a difference of 0.020%), Immigrants from Brazil (17.0%, a difference of 0.020%), French (17.0%, a difference of 0.030%), and Chilean (17.0%, a difference of 0.030%).
| Demographics | Rating | Rank | Cognitive Disability |
| Lebanese | 91.3 /100 | #135 | Exceptional 17.0% |
| Israelis | 91.0 /100 | #136 | Exceptional 17.0% |
| Immigrants | Norway | 90.9 /100 | #137 | Exceptional 17.0% |
| Welsh | 90.8 /100 | #138 | Exceptional 17.0% |
| French | 90.0 /100 | #139 | Excellent 17.0% |
| Chileans | 89.9 /100 | #140 | Excellent 17.0% |
| Aleuts | 89.9 /100 | #141 | Excellent 17.0% |
| Carpatho Rusyns | 89.6 /100 | #142 | Excellent 17.0% |
| British | 89.3 /100 | #143 | Excellent 17.0% |
| Immigrants | Brazil | 89.3 /100 | #144 | Excellent 17.0% |
| Immigrants | South Eastern Asia | 88.7 /100 | #145 | Excellent 17.0% |
| Costa Ricans | 88.0 /100 | #146 | Excellent 17.0% |
| Scotch-Irish | 85.9 /100 | #147 | Excellent 17.1% |
| French Canadians | 85.7 /100 | #148 | Excellent 17.1% |
| Cypriots | 85.7 /100 | #149 | Excellent 17.1% |
Demographics Similar to Peruvians by Cognitive Disability
In terms of cognitive disability, the demographic groups most similar to Peruvians are Immigrants from Hungary (16.7%, a difference of 0.0%), Immigrants from Serbia (16.7%, a difference of 0.010%), Immigrants from Bulgaria (16.7%, a difference of 0.010%), Estonian (16.7%, a difference of 0.030%), and Egyptian (16.7%, a difference of 0.030%).
| Demographics | Rating | Rank | Cognitive Disability |
| Immigrants | Belgium | 99.3 /100 | #71 | Exceptional 16.7% |
| Germans | 99.3 /100 | #72 | Exceptional 16.7% |
| Burmese | 99.3 /100 | #73 | Exceptional 16.7% |
| Slavs | 99.3 /100 | #74 | Exceptional 16.7% |
| Estonians | 99.3 /100 | #75 | Exceptional 16.7% |
| Immigrants | Serbia | 99.3 /100 | #76 | Exceptional 16.7% |
| Immigrants | Hungary | 99.3 /100 | #77 | Exceptional 16.7% |
| Peruvians | 99.3 /100 | #78 | Exceptional 16.7% |
| Immigrants | Bulgaria | 99.3 /100 | #79 | Exceptional 16.7% |
| Egyptians | 99.2 /100 | #80 | Exceptional 16.7% |
| Immigrants | Netherlands | 99.2 /100 | #81 | Exceptional 16.7% |
| Swiss | 99.2 /100 | #82 | Exceptional 16.7% |
| Serbians | 99.1 /100 | #83 | Exceptional 16.7% |
| Belgians | 99.1 /100 | #84 | Exceptional 16.7% |
| Immigrants | Moldova | 99.1 /100 | #85 | Exceptional 16.7% |