Carpatho Rusyn vs Russian Cognitive Disability
COMPARE
Carpatho Rusyn
Russian
Cognitive Disability
Cognitive Disability Comparison
Carpatho Rusyns
Russians
17.0%
COGNITIVE DISABILITY
89.6/ 100
METRIC RATING
142nd/ 347
METRIC RANK
16.4%
COGNITIVE DISABILITY
99.9/ 100
METRIC RATING
34th/ 347
METRIC RANK
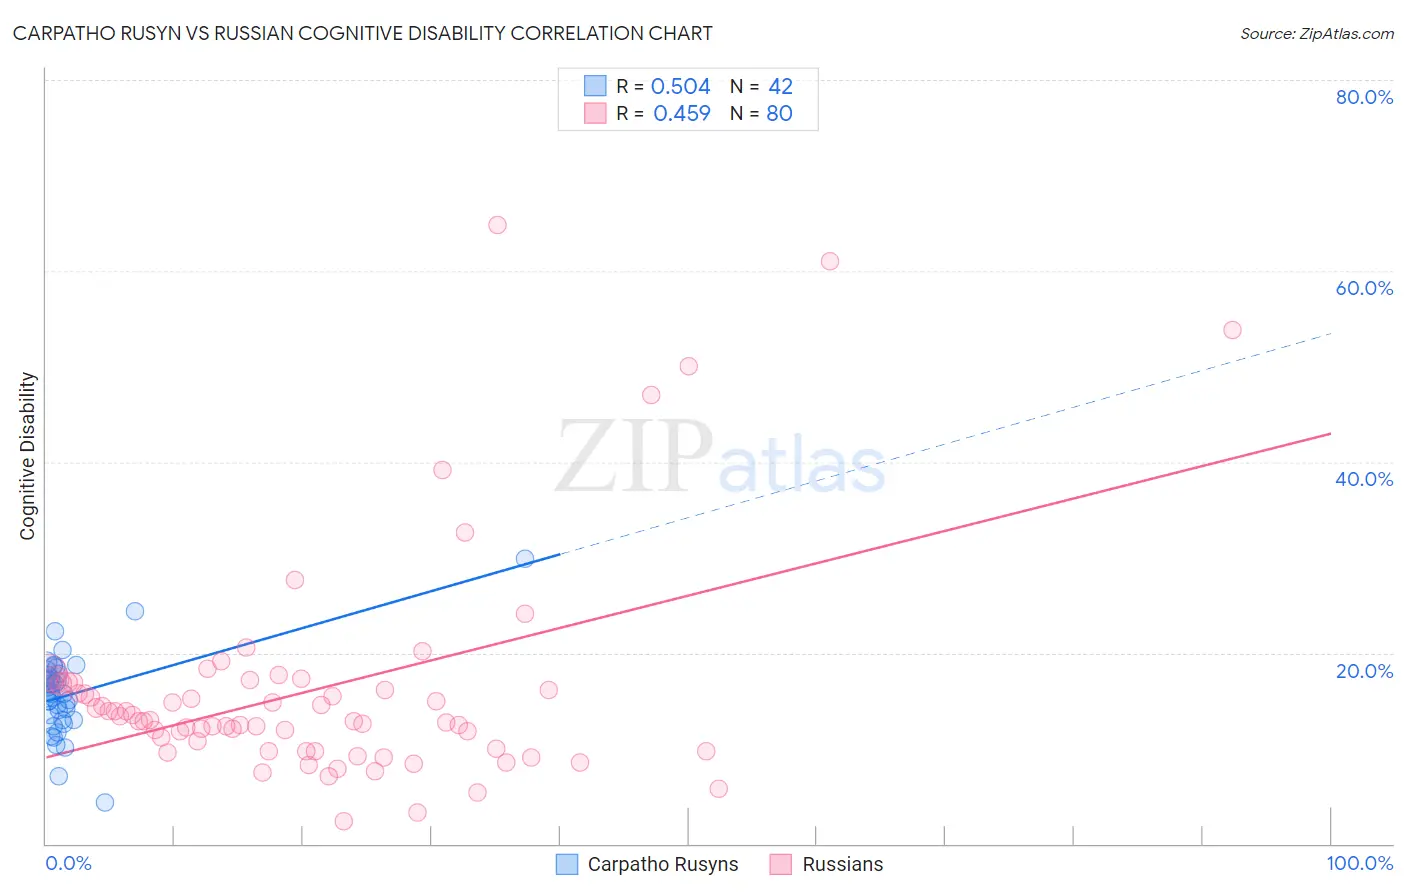
Carpatho Rusyn vs Russian Cognitive Disability Correlation Chart
The statistical analysis conducted on geographies consisting of 58,872,415 people shows a substantial positive correlation between the proportion of Carpatho Rusyns and percentage of population with cognitive disability in the United States with a correlation coefficient (R) of 0.504 and weighted average of 17.0%. Similarly, the statistical analysis conducted on geographies consisting of 512,152,080 people shows a moderate positive correlation between the proportion of Russians and percentage of population with cognitive disability in the United States with a correlation coefficient (R) of 0.459 and weighted average of 16.4%, a difference of 3.6%.
Cognitive Disability Correlation Summary
| Measurement | Carpatho Rusyn | Russian |
| Minimum | 4.3% | 2.3% |
| Maximum | 29.9% | 64.9% |
| Range | 25.6% | 62.5% |
| Mean | 15.6% | 16.1% |
| Median | 15.8% | 12.9% |
| Interquartile 25% (IQ1) | 13.0% | 9.9% |
| Interquartile 75% (IQ3) | 17.9% | 16.8% |
| Interquartile Range (IQR) | 4.9% | 7.0% |
| Standard Deviation (Sample) | 4.4% | 11.7% |
| Standard Deviation (Population) | 4.3% | 11.6% |
Similar Demographics by Cognitive Disability
Demographics Similar to Carpatho Rusyns by Cognitive Disability
In terms of cognitive disability, the demographic groups most similar to Carpatho Rusyns are Aleut (17.0%, a difference of 0.020%), British (17.0%, a difference of 0.020%), Immigrants from Brazil (17.0%, a difference of 0.020%), French (17.0%, a difference of 0.030%), and Chilean (17.0%, a difference of 0.030%).
| Demographics | Rating | Rank | Cognitive Disability |
| Lebanese | 91.3 /100 | #135 | Exceptional 17.0% |
| Israelis | 91.0 /100 | #136 | Exceptional 17.0% |
| Immigrants | Norway | 90.9 /100 | #137 | Exceptional 17.0% |
| Welsh | 90.8 /100 | #138 | Exceptional 17.0% |
| French | 90.0 /100 | #139 | Excellent 17.0% |
| Chileans | 89.9 /100 | #140 | Excellent 17.0% |
| Aleuts | 89.9 /100 | #141 | Excellent 17.0% |
| Carpatho Rusyns | 89.6 /100 | #142 | Excellent 17.0% |
| British | 89.3 /100 | #143 | Excellent 17.0% |
| Immigrants | Brazil | 89.3 /100 | #144 | Excellent 17.0% |
| Immigrants | South Eastern Asia | 88.7 /100 | #145 | Excellent 17.0% |
| Costa Ricans | 88.0 /100 | #146 | Excellent 17.0% |
| Scotch-Irish | 85.9 /100 | #147 | Excellent 17.1% |
| French Canadians | 85.7 /100 | #148 | Excellent 17.1% |
| Cypriots | 85.7 /100 | #149 | Excellent 17.1% |
Demographics Similar to Russians by Cognitive Disability
In terms of cognitive disability, the demographic groups most similar to Russians are Italian (16.4%, a difference of 0.0%), Immigrants from Israel (16.4%, a difference of 0.080%), Slovak (16.4%, a difference of 0.080%), Greek (16.4%, a difference of 0.090%), and Immigrants from Romania (16.4%, a difference of 0.13%).
| Demographics | Rating | Rank | Cognitive Disability |
| Immigrants | Pakistan | 99.9 /100 | #27 | Exceptional 16.4% |
| Poles | 99.9 /100 | #28 | Exceptional 16.4% |
| Filipinos | 99.9 /100 | #29 | Exceptional 16.4% |
| Czechs | 99.9 /100 | #30 | Exceptional 16.4% |
| Immigrants | Romania | 99.9 /100 | #31 | Exceptional 16.4% |
| Immigrants | Israel | 99.9 /100 | #32 | Exceptional 16.4% |
| Italians | 99.9 /100 | #33 | Exceptional 16.4% |
| Russians | 99.9 /100 | #34 | Exceptional 16.4% |
| Slovaks | 99.9 /100 | #35 | Exceptional 16.4% |
| Greeks | 99.9 /100 | #36 | Exceptional 16.4% |
| Slovenes | 99.9 /100 | #37 | Exceptional 16.5% |
| Immigrants | Eastern Europe | 99.9 /100 | #38 | Exceptional 16.5% |
| Bolivians | 99.9 /100 | #39 | Exceptional 16.5% |
| Immigrants | Belarus | 99.9 /100 | #40 | Exceptional 16.5% |
| Cubans | 99.9 /100 | #41 | Exceptional 16.5% |