Crow vs Immigrants from Trinidad and Tobago Disability Age Under 5
COMPARE
Crow
Immigrants from Trinidad and Tobago
Disability Age Under 5
Disability Age Under 5 Comparison
Crow
Immigrants from Trinidad and Tobago
1.2%
DISABILITY AGE UNDER 5
51.0/ 100
METRIC RATING
172nd/ 347
METRIC RANK
1.1%
DISABILITY AGE UNDER 5
98.0/ 100
METRIC RATING
80th/ 347
METRIC RANK
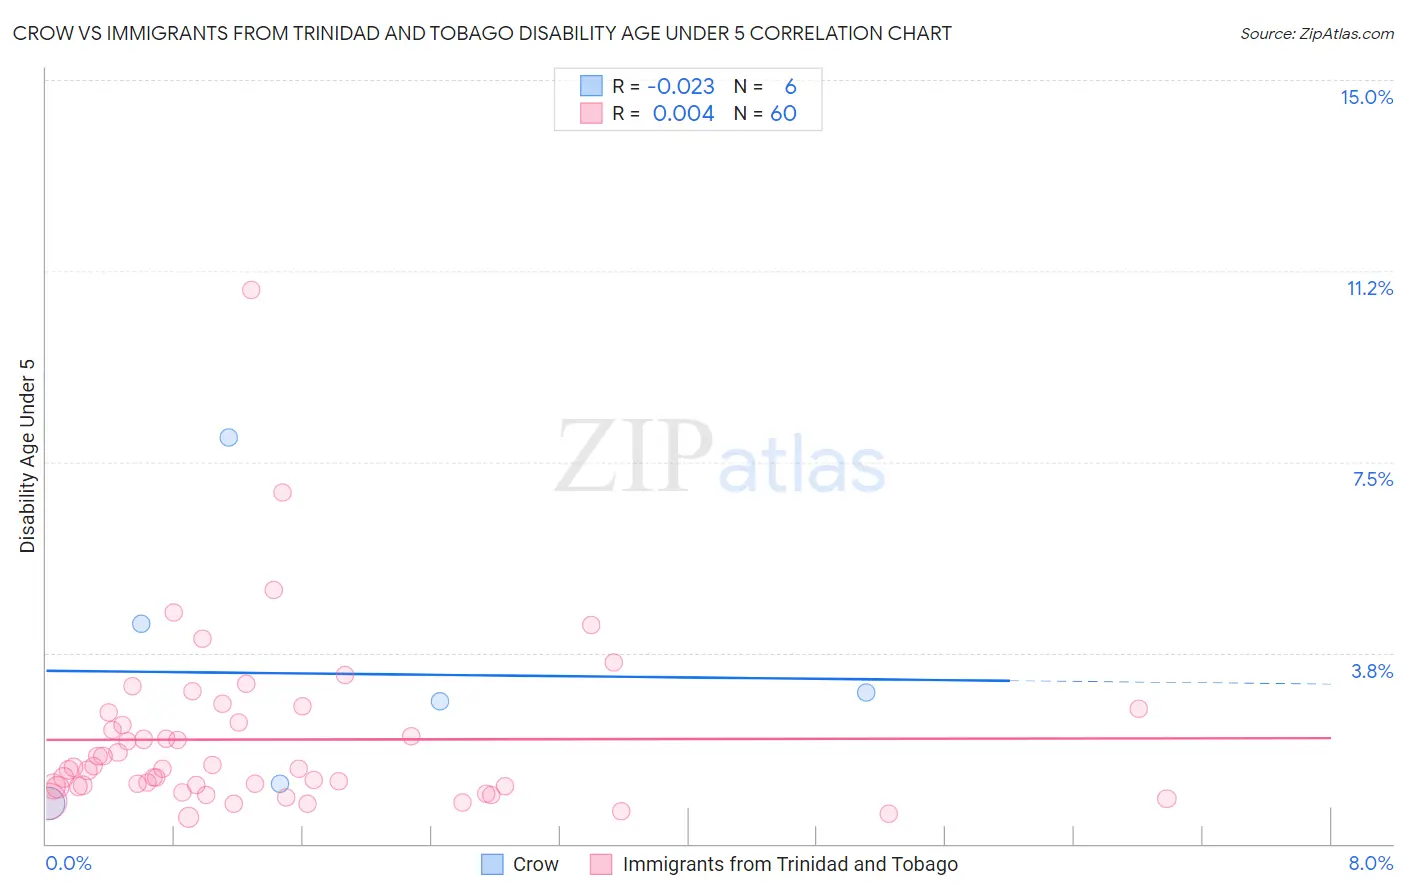
Crow vs Immigrants from Trinidad and Tobago Disability Age Under 5 Correlation Chart
The statistical analysis conducted on geographies consisting of 49,259,898 people shows no correlation between the proportion of Crow and percentage of population with a disability under the age of 5 in the United States with a correlation coefficient (R) of -0.023 and weighted average of 1.2%. Similarly, the statistical analysis conducted on geographies consisting of 139,979,956 people shows no correlation between the proportion of Immigrants from Trinidad and Tobago and percentage of population with a disability under the age of 5 in the United States with a correlation coefficient (R) of 0.004 and weighted average of 1.1%, a difference of 9.5%.
Disability Age Under 5 Correlation Summary
| Measurement | Crow | Immigrants from Trinidad and Tobago |
| Minimum | 0.78% | 0.53% |
| Maximum | 8.0% | 10.9% |
| Range | 7.2% | 10.3% |
| Mean | 3.3% | 2.0% |
| Median | 2.9% | 1.5% |
| Interquartile 25% (IQ1) | 1.2% | 1.1% |
| Interquartile 75% (IQ3) | 4.3% | 2.5% |
| Interquartile Range (IQR) | 3.1% | 1.4% |
| Standard Deviation (Sample) | 2.6% | 1.7% |
| Standard Deviation (Population) | 2.4% | 1.7% |
Similar Demographics by Disability Age Under 5
Demographics Similar to Crow by Disability Age Under 5
In terms of disability age under 5, the demographic groups most similar to Crow are Immigrants from Ireland (1.2%, a difference of 0.070%), Immigrants from Latvia (1.2%, a difference of 0.090%), Immigrants from Nigeria (1.2%, a difference of 0.090%), Immigrants from Kenya (1.2%, a difference of 0.22%), and Comanche (1.2%, a difference of 0.32%).
| Demographics | Rating | Rank | Disability Age Under 5 |
| Immigrants | Kuwait | 62.6 /100 | #165 | Good 1.2% |
| Immigrants | Central America | 61.4 /100 | #166 | Good 1.2% |
| Immigrants | Argentina | 60.2 /100 | #167 | Good 1.2% |
| Sierra Leoneans | 59.1 /100 | #168 | Average 1.2% |
| Immigrants | Uruguay | 59.0 /100 | #169 | Average 1.2% |
| Immigrants | Jamaica | 58.8 /100 | #170 | Average 1.2% |
| Guamanians/Chamorros | 57.8 /100 | #171 | Average 1.2% |
| Crow | 51.0 /100 | #172 | Average 1.2% |
| Immigrants | Ireland | 50.3 /100 | #173 | Average 1.2% |
| Immigrants | Latvia | 50.0 /100 | #174 | Average 1.2% |
| Immigrants | Nigeria | 50.0 /100 | #175 | Average 1.2% |
| Immigrants | Kenya | 48.6 /100 | #176 | Average 1.2% |
| Comanche | 47.5 /100 | #177 | Average 1.2% |
| Venezuelans | 47.1 /100 | #178 | Average 1.2% |
| Immigrants | Bahamas | 45.2 /100 | #179 | Average 1.2% |
Demographics Similar to Immigrants from Trinidad and Tobago by Disability Age Under 5
In terms of disability age under 5, the demographic groups most similar to Immigrants from Trinidad and Tobago are Hmong (1.1%, a difference of 0.020%), Turkish (1.1%, a difference of 0.020%), West Indian (1.1%, a difference of 0.040%), Immigrants from Jordan (1.1%, a difference of 0.13%), and Immigrants from Syria (1.1%, a difference of 0.14%).
| Demographics | Rating | Rank | Disability Age Under 5 |
| Immigrants | Sri Lanka | 98.5 /100 | #73 | Exceptional 1.1% |
| Jordanians | 98.5 /100 | #74 | Exceptional 1.1% |
| Immigrants | Pakistan | 98.4 /100 | #75 | Exceptional 1.1% |
| Immigrants | Burma/Myanmar | 98.2 /100 | #76 | Exceptional 1.1% |
| Immigrants | Denmark | 98.1 /100 | #77 | Exceptional 1.1% |
| West Indians | 98.0 /100 | #78 | Exceptional 1.1% |
| Hmong | 98.0 /100 | #79 | Exceptional 1.1% |
| Immigrants | Trinidad and Tobago | 98.0 /100 | #80 | Exceptional 1.1% |
| Turks | 98.0 /100 | #81 | Exceptional 1.1% |
| Immigrants | Jordan | 97.9 /100 | #82 | Exceptional 1.1% |
| Immigrants | Syria | 97.9 /100 | #83 | Exceptional 1.1% |
| Immigrants | Zaire | 97.8 /100 | #84 | Exceptional 1.1% |
| Sudanese | 97.7 /100 | #85 | Exceptional 1.1% |
| Okinawans | 97.6 /100 | #86 | Exceptional 1.1% |
| Ugandans | 97.5 /100 | #87 | Exceptional 1.1% |