Canadian vs Cypriot Cognitive Disability
COMPARE
Canadian
Cypriot
Cognitive Disability
Cognitive Disability Comparison
Canadians
Cypriots
16.8%
COGNITIVE DISABILITY
97.5/ 100
METRIC RATING
108th/ 347
METRIC RANK
17.1%
COGNITIVE DISABILITY
85.7/ 100
METRIC RATING
149th/ 347
METRIC RANK
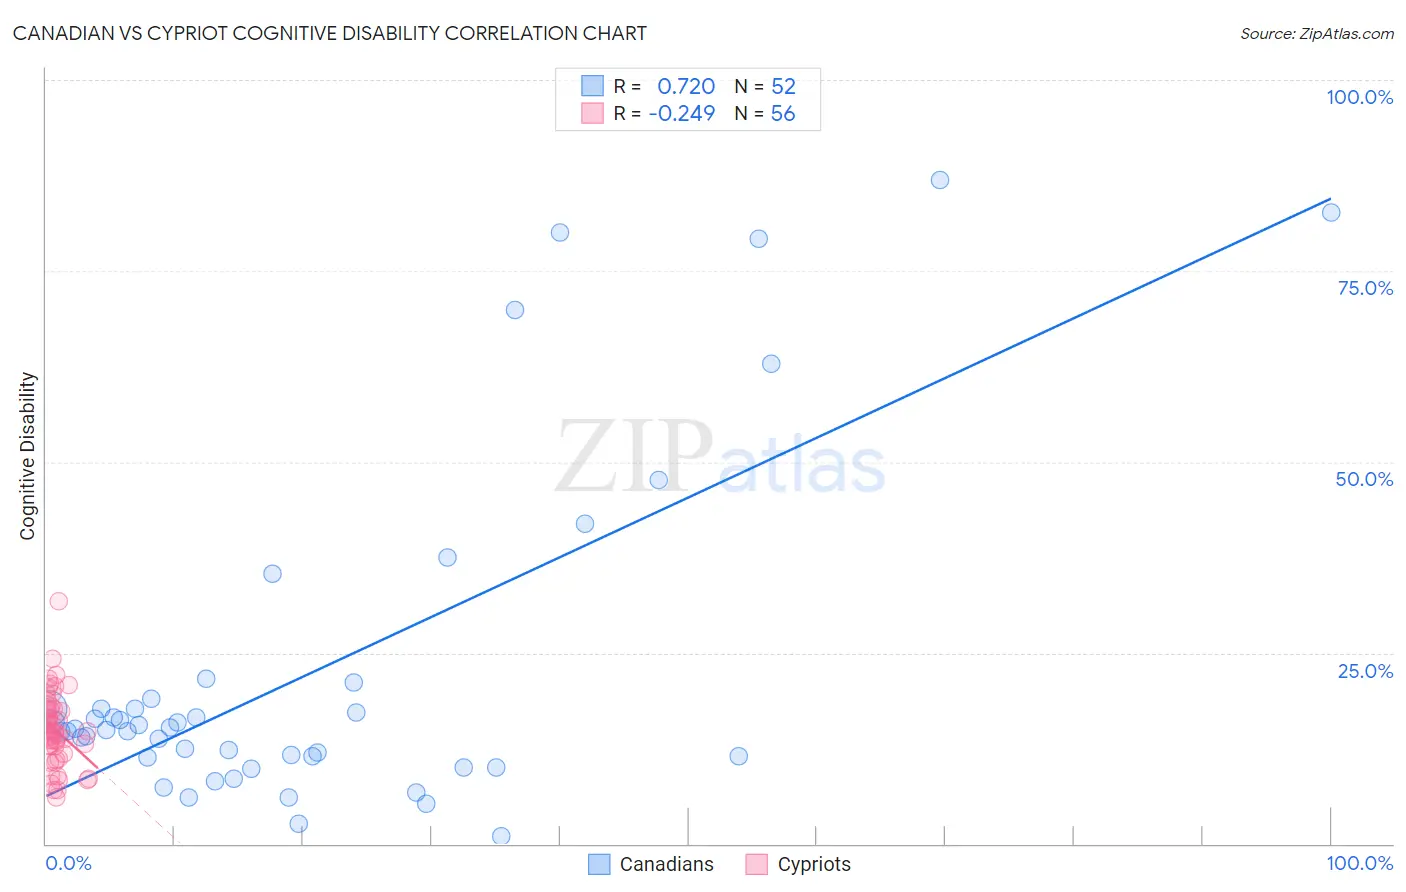
Canadian vs Cypriot Cognitive Disability Correlation Chart
The statistical analysis conducted on geographies consisting of 437,506,516 people shows a strong positive correlation between the proportion of Canadians and percentage of population with cognitive disability in the United States with a correlation coefficient (R) of 0.720 and weighted average of 16.8%. Similarly, the statistical analysis conducted on geographies consisting of 61,869,277 people shows a weak negative correlation between the proportion of Cypriots and percentage of population with cognitive disability in the United States with a correlation coefficient (R) of -0.249 and weighted average of 17.1%, a difference of 1.4%.
Cognitive Disability Correlation Summary
| Measurement | Canadian | Cypriot |
| Minimum | 1.0% | 6.1% |
| Maximum | 87.0% | 31.8% |
| Range | 85.9% | 25.6% |
| Mean | 22.4% | 14.9% |
| Median | 15.0% | 14.7% |
| Interquartile 25% (IQ1) | 11.3% | 12.3% |
| Interquartile 75% (IQ3) | 18.4% | 17.7% |
| Interquartile Range (IQR) | 7.1% | 5.5% |
| Standard Deviation (Sample) | 21.9% | 4.8% |
| Standard Deviation (Population) | 21.7% | 4.8% |
Similar Demographics by Cognitive Disability
Demographics Similar to Canadians by Cognitive Disability
In terms of cognitive disability, the demographic groups most similar to Canadians are Albanian (16.8%, a difference of 0.050%), Arapaho (16.8%, a difference of 0.060%), Uruguayan (16.8%, a difference of 0.070%), Immigrants from Nicaragua (16.8%, a difference of 0.090%), and Indian (Asian) (16.8%, a difference of 0.090%).
| Demographics | Rating | Rank | Cognitive Disability |
| Immigrants | Asia | 98.1 /100 | #101 | Exceptional 16.8% |
| Irish | 98.1 /100 | #102 | Exceptional 16.8% |
| Paraguayans | 98.0 /100 | #103 | Exceptional 16.8% |
| Palestinians | 98.0 /100 | #104 | Exceptional 16.8% |
| Immigrants | Eastern Asia | 97.9 /100 | #105 | Exceptional 16.8% |
| Northern Europeans | 97.8 /100 | #106 | Exceptional 16.8% |
| Immigrants | Nicaragua | 97.8 /100 | #107 | Exceptional 16.8% |
| Canadians | 97.5 /100 | #108 | Exceptional 16.8% |
| Albanians | 97.3 /100 | #109 | Exceptional 16.8% |
| Arapaho | 97.3 /100 | #110 | Exceptional 16.8% |
| Uruguayans | 97.2 /100 | #111 | Exceptional 16.8% |
| Indians (Asian) | 97.2 /100 | #112 | Exceptional 16.8% |
| Immigrants | Sri Lanka | 97.1 /100 | #113 | Exceptional 16.8% |
| Koreans | 97.1 /100 | #114 | Exceptional 16.8% |
| Yup'ik | 96.9 /100 | #115 | Exceptional 16.9% |
Demographics Similar to Cypriots by Cognitive Disability
In terms of cognitive disability, the demographic groups most similar to Cypriots are French Canadian (17.1%, a difference of 0.0%), Scotch-Irish (17.1%, a difference of 0.010%), Basque (17.1%, a difference of 0.010%), Costa Rican (17.0%, a difference of 0.14%), and Syrian (17.1%, a difference of 0.15%).
| Demographics | Rating | Rank | Cognitive Disability |
| Carpatho Rusyns | 89.6 /100 | #142 | Excellent 17.0% |
| British | 89.3 /100 | #143 | Excellent 17.0% |
| Immigrants | Brazil | 89.3 /100 | #144 | Excellent 17.0% |
| Immigrants | South Eastern Asia | 88.7 /100 | #145 | Excellent 17.0% |
| Costa Ricans | 88.0 /100 | #146 | Excellent 17.0% |
| Scotch-Irish | 85.9 /100 | #147 | Excellent 17.1% |
| French Canadians | 85.7 /100 | #148 | Excellent 17.1% |
| Cypriots | 85.7 /100 | #149 | Excellent 17.1% |
| Basques | 85.5 /100 | #150 | Excellent 17.1% |
| Syrians | 83.0 /100 | #151 | Excellent 17.1% |
| Immigrants | Indonesia | 82.7 /100 | #152 | Excellent 17.1% |
| Immigrants | Kazakhstan | 80.5 /100 | #153 | Excellent 17.1% |
| Immigrants | Malaysia | 79.3 /100 | #154 | Good 17.1% |
| Brazilians | 78.9 /100 | #155 | Good 17.1% |
| Sri Lankans | 78.9 /100 | #156 | Good 17.1% |