Armenian vs U.S. Virgin Islander Ambulatory Disability
COMPARE
Armenian
U.S. Virgin Islander
Ambulatory Disability
Ambulatory Disability Comparison
Armenians
U.S. Virgin Islanders
6.5%
AMBULATORY DISABILITY
1.5/ 100
METRIC RATING
246th/ 347
METRIC RANK
6.8%
AMBULATORY DISABILITY
0.0/ 100
METRIC RATING
287th/ 347
METRIC RANK
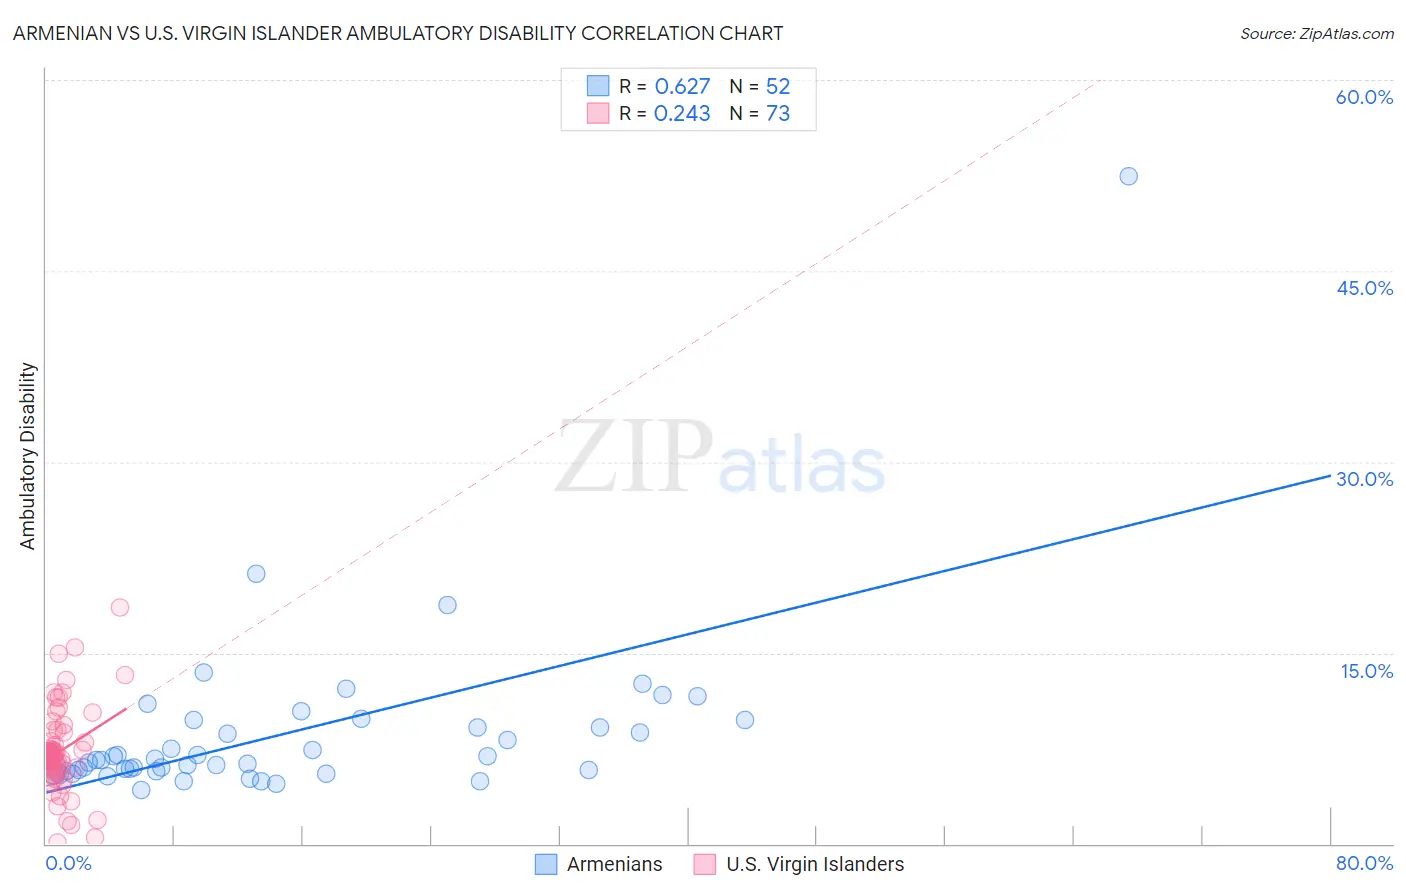
Armenian vs U.S. Virgin Islander Ambulatory Disability Correlation Chart
The statistical analysis conducted on geographies consisting of 310,863,857 people shows a significant positive correlation between the proportion of Armenians and percentage of population with ambulatory disability in the United States with a correlation coefficient (R) of 0.627 and weighted average of 6.5%. Similarly, the statistical analysis conducted on geographies consisting of 87,521,304 people shows a weak positive correlation between the proportion of U.S. Virgin Islanders and percentage of population with ambulatory disability in the United States with a correlation coefficient (R) of 0.243 and weighted average of 6.8%, a difference of 5.8%.
Ambulatory Disability Correlation Summary
| Measurement | Armenian | U.S. Virgin Islander |
| Minimum | 4.2% | 0.13% |
| Maximum | 52.5% | 18.6% |
| Range | 48.3% | 18.5% |
| Mean | 8.7% | 7.2% |
| Median | 6.6% | 6.9% |
| Interquartile 25% (IQ1) | 5.7% | 6.0% |
| Interquartile 75% (IQ3) | 9.4% | 8.0% |
| Interquartile Range (IQR) | 3.7% | 2.0% |
| Standard Deviation (Sample) | 7.0% | 3.2% |
| Standard Deviation (Population) | 7.0% | 3.2% |
Similar Demographics by Ambulatory Disability
Demographics Similar to Armenians by Ambulatory Disability
In terms of ambulatory disability, the demographic groups most similar to Armenians are Tlingit-Haida (6.5%, a difference of 0.020%), German (6.5%, a difference of 0.050%), Immigrants from Panama (6.5%, a difference of 0.050%), Immigrants from Cuba (6.5%, a difference of 0.050%), and Spaniard (6.5%, a difference of 0.070%).
| Demographics | Rating | Rank | Ambulatory Disability |
| Senegalese | 1.7 /100 | #239 | Tragic 6.4% |
| Immigrants | Senegal | 1.7 /100 | #240 | Tragic 6.4% |
| Immigrants | Haiti | 1.6 /100 | #241 | Tragic 6.5% |
| Spaniards | 1.6 /100 | #242 | Tragic 6.5% |
| Germans | 1.5 /100 | #243 | Tragic 6.5% |
| Immigrants | Panama | 1.5 /100 | #244 | Tragic 6.5% |
| Tlingit-Haida | 1.5 /100 | #245 | Tragic 6.5% |
| Armenians | 1.5 /100 | #246 | Tragic 6.5% |
| Immigrants | Cuba | 1.4 /100 | #247 | Tragic 6.5% |
| Immigrants | Portugal | 1.4 /100 | #248 | Tragic 6.5% |
| Native Hawaiians | 1.1 /100 | #249 | Tragic 6.5% |
| Chinese | 1.0 /100 | #250 | Tragic 6.5% |
| Hawaiians | 0.9 /100 | #251 | Tragic 6.5% |
| Immigrants | Bahamas | 0.8 /100 | #252 | Tragic 6.5% |
| Scottish | 0.7 /100 | #253 | Tragic 6.5% |
Demographics Similar to U.S. Virgin Islanders by Ambulatory Disability
In terms of ambulatory disability, the demographic groups most similar to U.S. Virgin Islanders are Nonimmigrants (6.9%, a difference of 0.27%), Yakama (6.8%, a difference of 0.32%), Fijian (6.8%, a difference of 0.36%), Immigrants from Dominica (6.9%, a difference of 0.41%), and Scotch-Irish (6.9%, a difference of 0.44%).
| Demographics | Rating | Rank | Ambulatory Disability |
| Pennsylvania Germans | 0.0 /100 | #280 | Tragic 6.8% |
| Yaqui | 0.0 /100 | #281 | Tragic 6.8% |
| Barbadians | 0.0 /100 | #282 | Tragic 6.8% |
| Immigrants | Barbados | 0.0 /100 | #283 | Tragic 6.8% |
| Immigrants | Jamaica | 0.0 /100 | #284 | Tragic 6.8% |
| Fijians | 0.0 /100 | #285 | Tragic 6.8% |
| Yakama | 0.0 /100 | #286 | Tragic 6.8% |
| U.S. Virgin Islanders | 0.0 /100 | #287 | Tragic 6.8% |
| Immigrants | Nonimmigrants | 0.0 /100 | #288 | Tragic 6.9% |
| Immigrants | Dominica | 0.0 /100 | #289 | Tragic 6.9% |
| Scotch-Irish | 0.0 /100 | #290 | Tragic 6.9% |
| West Indians | 0.0 /100 | #291 | Tragic 6.9% |
| Cheyenne | 0.0 /100 | #292 | Tragic 6.9% |
| Immigrants | St. Vincent and the Grenadines | 0.0 /100 | #293 | Tragic 6.9% |
| Cape Verdeans | 0.0 /100 | #294 | Tragic 6.9% |