Cajun vs Immigrants from Southern Europe Male Disability
COMPARE
Cajun
Immigrants from Southern Europe
Male Disability
Male Disability Comparison
Cajuns
Immigrants from Southern Europe
14.4%
MALE DISABILITY
0.0/ 100
METRIC RATING
329th/ 347
METRIC RANK
11.2%
MALE DISABILITY
54.4/ 100
METRIC RATING
167th/ 347
METRIC RANK
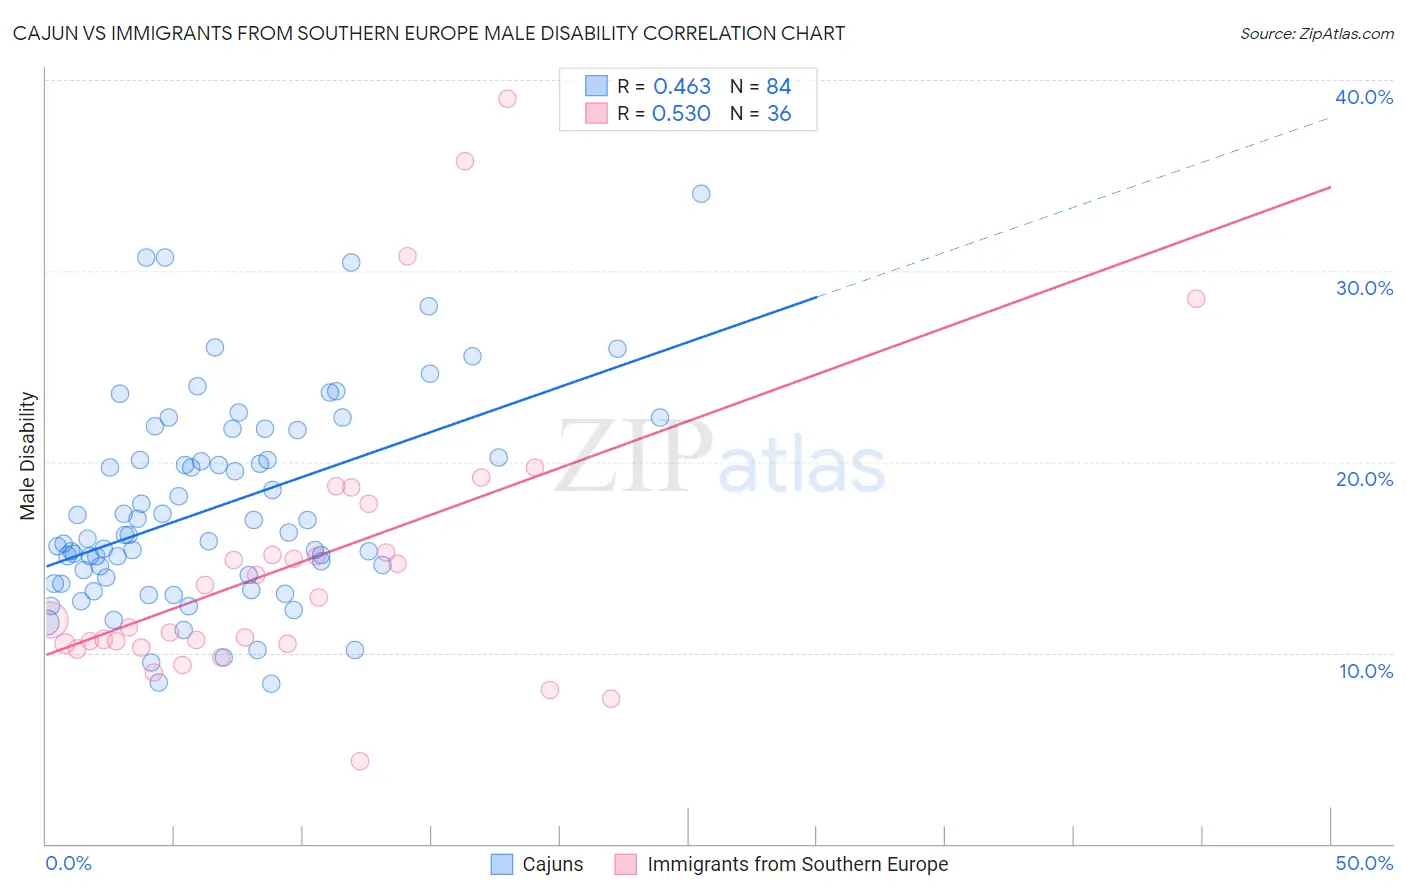
Cajun vs Immigrants from Southern Europe Male Disability Correlation Chart
The statistical analysis conducted on geographies consisting of 149,697,026 people shows a moderate positive correlation between the proportion of Cajuns and percentage of males with a disability in the United States with a correlation coefficient (R) of 0.463 and weighted average of 14.4%. Similarly, the statistical analysis conducted on geographies consisting of 402,778,733 people shows a substantial positive correlation between the proportion of Immigrants from Southern Europe and percentage of males with a disability in the United States with a correlation coefficient (R) of 0.530 and weighted average of 11.2%, a difference of 28.4%.
Male Disability Correlation Summary
| Measurement | Cajun | Immigrants from Southern Europe |
| Minimum | 8.4% | 4.3% |
| Maximum | 34.1% | 39.0% |
| Range | 25.7% | 34.7% |
| Mean | 17.7% | 14.9% |
| Median | 16.2% | 12.3% |
| Interquartile 25% (IQ1) | 14.0% | 10.5% |
| Interquartile 75% (IQ3) | 21.0% | 16.5% |
| Interquartile Range (IQR) | 7.0% | 6.0% |
| Standard Deviation (Sample) | 5.4% | 7.7% |
| Standard Deviation (Population) | 5.4% | 7.6% |
Similar Demographics by Male Disability
Demographics Similar to Cajuns by Male Disability
In terms of male disability, the demographic groups most similar to Cajuns are Navajo (14.4%, a difference of 0.23%), Chippewa (14.3%, a difference of 0.57%), Potawatomi (14.2%, a difference of 1.0%), Native/Alaskan (14.2%, a difference of 1.1%), and Tohono O'odham (14.6%, a difference of 1.7%).
| Demographics | Rating | Rank | Male Disability |
| Apache | 0.0 /100 | #322 | Tragic 14.0% |
| Osage | 0.0 /100 | #323 | Tragic 14.0% |
| Comanche | 0.0 /100 | #324 | Tragic 14.1% |
| Ottawa | 0.0 /100 | #325 | Tragic 14.1% |
| Natives/Alaskans | 0.0 /100 | #326 | Tragic 14.2% |
| Potawatomi | 0.0 /100 | #327 | Tragic 14.2% |
| Chippewa | 0.0 /100 | #328 | Tragic 14.3% |
| Cajuns | 0.0 /100 | #329 | Tragic 14.4% |
| Navajo | 0.0 /100 | #330 | Tragic 14.4% |
| Tohono O'odham | 0.0 /100 | #331 | Tragic 14.6% |
| Seminole | 0.0 /100 | #332 | Tragic 14.7% |
| Yuman | 0.0 /100 | #333 | Tragic 14.7% |
| Cherokee | 0.0 /100 | #334 | Tragic 14.8% |
| Dutch West Indians | 0.0 /100 | #335 | Tragic 14.8% |
| Alaskan Athabascans | 0.0 /100 | #336 | Tragic 14.9% |
Demographics Similar to Immigrants from Southern Europe by Male Disability
In terms of male disability, the demographic groups most similar to Immigrants from Southern Europe are Immigrants from Latin America (11.2%, a difference of 0.020%), Barbadian (11.2%, a difference of 0.060%), New Zealander (11.2%, a difference of 0.080%), Haitian (11.2%, a difference of 0.10%), and Romanian (11.2%, a difference of 0.20%).
| Demographics | Rating | Rank | Male Disability |
| Albanians | 66.5 /100 | #160 | Good 11.1% |
| Immigrants | West Indies | 65.7 /100 | #161 | Good 11.1% |
| Immigrants | Haiti | 65.3 /100 | #162 | Good 11.1% |
| Immigrants | Kenya | 63.8 /100 | #163 | Good 11.1% |
| British West Indians | 62.8 /100 | #164 | Good 11.1% |
| Luxembourgers | 61.9 /100 | #165 | Good 11.1% |
| Immigrants | Hungary | 61.2 /100 | #166 | Good 11.1% |
| Immigrants | Southern Europe | 54.4 /100 | #167 | Average 11.2% |
| Immigrants | Latin America | 54.0 /100 | #168 | Average 11.2% |
| Barbadians | 53.4 /100 | #169 | Average 11.2% |
| New Zealanders | 52.9 /100 | #170 | Average 11.2% |
| Haitians | 52.5 /100 | #171 | Average 11.2% |
| Romanians | 50.7 /100 | #172 | Average 11.2% |
| Immigrants | Burma/Myanmar | 50.4 /100 | #173 | Average 11.2% |
| Maltese | 50.0 /100 | #174 | Average 11.2% |