Cajun vs French American Indian 7th Grade
COMPARE
Cajun
French American Indian
7th Grade
7th Grade Comparison
Cajuns
French American Indians
96.8%
7TH GRADE
99.5/ 100
METRIC RATING
72nd/ 347
METRIC RANK
96.3%
7TH GRADE
83.1/ 100
METRIC RATING
147th/ 347
METRIC RANK
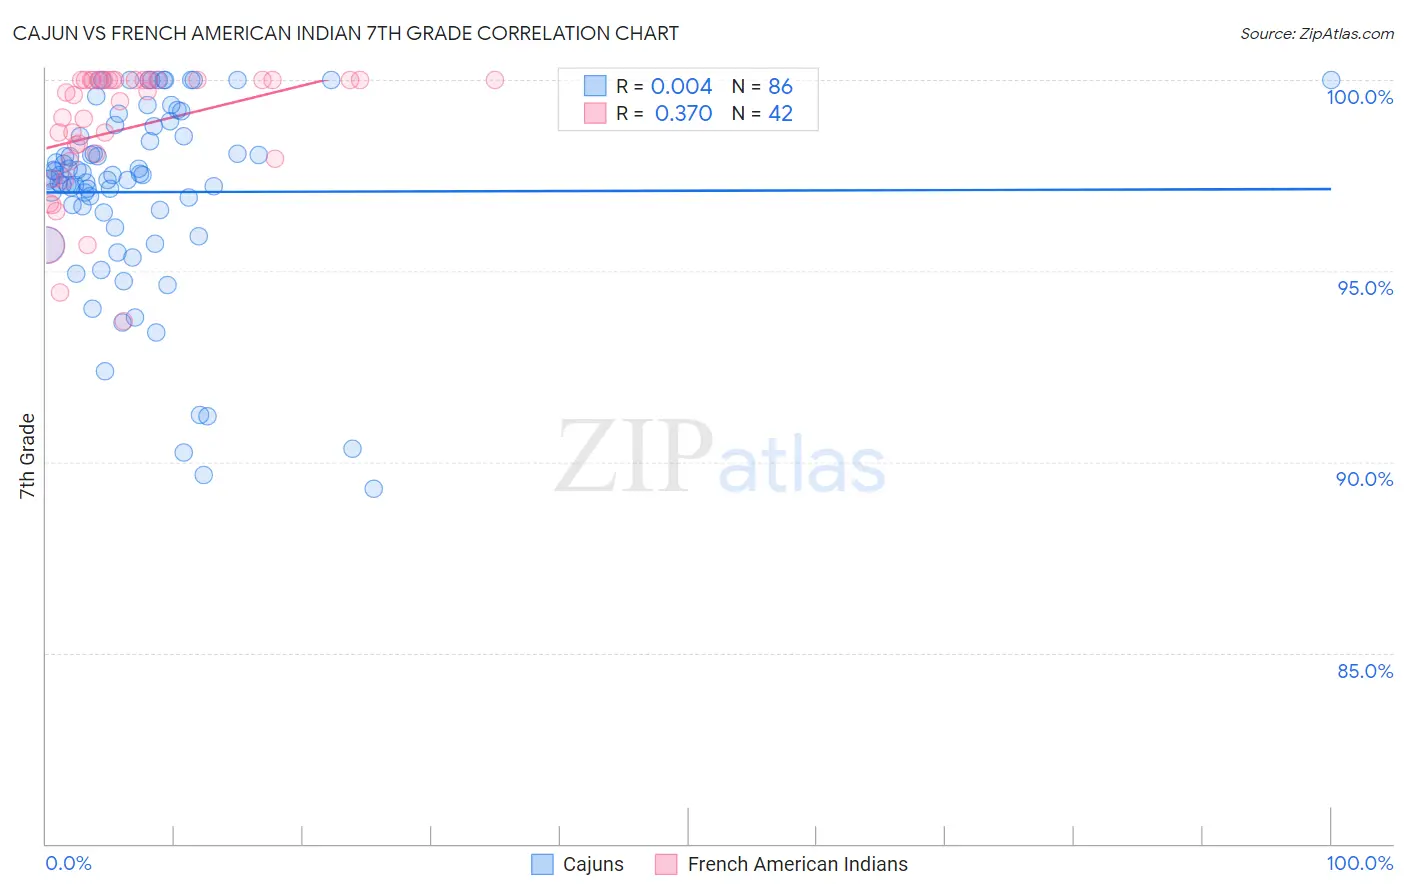
Cajun vs French American Indian 7th Grade Correlation Chart
The statistical analysis conducted on geographies consisting of 149,712,957 people shows no correlation between the proportion of Cajuns and percentage of population with at least 7th grade education in the United States with a correlation coefficient (R) of 0.004 and weighted average of 96.8%. Similarly, the statistical analysis conducted on geographies consisting of 131,974,096 people shows a mild positive correlation between the proportion of French American Indians and percentage of population with at least 7th grade education in the United States with a correlation coefficient (R) of 0.370 and weighted average of 96.3%, a difference of 0.58%.
7th Grade Correlation Summary
| Measurement | Cajun | French American Indian |
| Minimum | 89.3% | 93.7% |
| Maximum | 100.0% | 100.0% |
| Range | 10.7% | 6.3% |
| Mean | 97.1% | 98.7% |
| Median | 97.5% | 99.6% |
| Interquartile 25% (IQ1) | 96.5% | 97.9% |
| Interquartile 75% (IQ3) | 98.8% | 100.0% |
| Interquartile Range (IQR) | 2.2% | 2.1% |
| Standard Deviation (Sample) | 2.5% | 1.7% |
| Standard Deviation (Population) | 2.5% | 1.7% |
Similar Demographics by 7th Grade
Demographics Similar to Cajuns by 7th Grade
In terms of 7th grade, the demographic groups most similar to Cajuns are New Zealander (96.8%, a difference of 0.010%), Immigrants from Lithuania (96.8%, a difference of 0.010%), Arapaho (96.8%, a difference of 0.010%), Iranian (96.8%, a difference of 0.020%), and Immigrants from England (96.8%, a difference of 0.030%).
| Demographics | Rating | Rank | 7th Grade |
| Canadians | 99.7 /100 | #65 | Exceptional 96.9% |
| Ukrainians | 99.7 /100 | #66 | Exceptional 96.9% |
| Native Hawaiians | 99.7 /100 | #67 | Exceptional 96.9% |
| Immigrants | India | 99.6 /100 | #68 | Exceptional 96.9% |
| Iranians | 99.6 /100 | #69 | Exceptional 96.8% |
| New Zealanders | 99.6 /100 | #70 | Exceptional 96.8% |
| Immigrants | Lithuania | 99.6 /100 | #71 | Exceptional 96.8% |
| Cajuns | 99.5 /100 | #72 | Exceptional 96.8% |
| Arapaho | 99.5 /100 | #73 | Exceptional 96.8% |
| Immigrants | England | 99.5 /100 | #74 | Exceptional 96.8% |
| Zimbabweans | 99.5 /100 | #75 | Exceptional 96.8% |
| Immigrants | Ireland | 99.4 /100 | #76 | Exceptional 96.8% |
| Cherokee | 99.4 /100 | #77 | Exceptional 96.8% |
| Immigrants | Netherlands | 99.3 /100 | #78 | Exceptional 96.8% |
| Cypriots | 99.3 /100 | #79 | Exceptional 96.8% |
Demographics Similar to French American Indians by 7th Grade
In terms of 7th grade, the demographic groups most similar to French American Indians are Israeli (96.3%, a difference of 0.0%), Albanian (96.3%, a difference of 0.0%), Blackfeet (96.3%, a difference of 0.010%), Immigrants from Eastern Europe (96.3%, a difference of 0.010%), and Immigrants from Belarus (96.3%, a difference of 0.010%).
| Demographics | Rating | Rank | 7th Grade |
| Cambodians | 88.3 /100 | #140 | Excellent 96.3% |
| Immigrants | South Central Asia | 87.1 /100 | #141 | Excellent 96.3% |
| Burmese | 87.1 /100 | #142 | Excellent 96.3% |
| Spanish | 86.6 /100 | #143 | Excellent 96.3% |
| Immigrants | Greece | 85.9 /100 | #144 | Excellent 96.3% |
| Blackfeet | 83.9 /100 | #145 | Excellent 96.3% |
| Immigrants | Eastern Europe | 83.7 /100 | #146 | Excellent 96.3% |
| French American Indians | 83.1 /100 | #147 | Excellent 96.3% |
| Israelis | 82.8 /100 | #148 | Excellent 96.3% |
| Albanians | 82.6 /100 | #149 | Excellent 96.3% |
| Immigrants | Belarus | 82.4 /100 | #150 | Excellent 96.3% |
| Hopi | 81.6 /100 | #151 | Excellent 96.3% |
| Immigrants | Russia | 78.4 /100 | #152 | Good 96.2% |
| Seminole | 78.1 /100 | #153 | Good 96.2% |
| Immigrants | Israel | 77.6 /100 | #154 | Good 96.2% |