Vietnamese vs Immigrants from Albania Hearing Disability

COMPARE

Vietnamese
Race
Ancestry
AfghanAfricanAlaska NativeAlaskan AthabascanAlbanianAleutAlsatianAmericanApacheArabArapahoArgentineanArmenianAssyrian/Chaldean/SyriacAustralianAustrianBahamianBangladeshiBarbadianBasqueBelgianBelizeanBermudanBhutaneseBlackfeetBolivianBrazilianBritishBritish West IndianBulgarianBurmeseCajunCambodianCanadianCape VerdeanCarpatho RusynCelticCentral AmericanCentral American IndianCherokeeCheyenneChickasawChileanChineseChippewaChoctawColombianColvilleComancheCosta RicanCreeCreekCroatianCrowCubanCypriotCzechCzechoslovakianDanishDelawareDominicanDutchDutch West IndianEastern EuropeanEcuadorianEgyptianEnglishEstonianEthiopianEuropeanFijianFilipinoFinnishFrenchFrench American IndianFrench CanadianGermanGerman RussianGhanaianGreekGuamanian/ChamorroGuatemalanGuyaneseHaitianHmongHonduranHopiHoumaHungarianIcelanderIndian (Asian)IndonesianInupiatIranianIraqiIrishIroquoisIsraeliItalianJamaicanJapaneseJordanianKenyanKiowaKoreanLaotianLatvianLebaneseLiberianLithuanianLumbeeLuxembourgerMacedonianMalaysianMalteseMarshalleseMenomineeMexicanMexican American IndianMongolianMoroccanNative HawaiianNavajoNepaleseNew ZealanderNicaraguanNigerianNorthern EuropeanNorwegianOkinawanOsageOttawaPaiutePakistaniPalestinianPanamanianParaguayanPennsylvania GermanPeruvianPimaPolishPortuguesePotawatomiPuebloPuerto RicanPuget Sound SalishRomanianRussianSalvadoranSamoanScandinavianScotch-IrishScottishSeminoleSenegaleseSerbianShoshoneSierra LeoneanSiouxSlavicSlovakSloveneSomaliSouth AfricanSouth AmericanSouth American IndianSoviet UnionSpaniardSpanishSpanish AmericanSpanish American IndianSri LankanSubsaharan AfricanSudaneseSwedishSwissSyrianTaiwaneseThaiTlingit-HaidaTohono O'OdhamTonganTrinidadian and TobagonianTsimshianTurkishU.S. Virgin IslanderUgandanUkrainianUruguayanUteVenezuelanVietnameseWelshWest IndianYakamaYaquiYugoslavianYumanYup'ikZimbabwean
Immigration
NonimmigrantsImmigrantsAfghanistanAfricaArgentinaArmeniaAsiaAustraliaAustriaBahamasBangladeshBarbadosBelarusBelgiumBelizeBoliviaBosnia and HerzegovinaBrazilBulgariaBurma/MyanmarCabo VerdeCambodiaCameroonCanadaCaribbeanCentral AmericaChileChinaColombiaCongoCosta RicaCroatiaCubaCzechoslovakiaDenmarkDominicaDominican RepublicEastern AfricaEastern AsiaEastern EuropeEcuadorEgyptEl SalvadorEnglandEritreaEthiopiaEuropeFijiFranceGermanyGhanaGreeceGrenadaGuatemalaGuyanaHaitiHondurasHong KongHungaryIndiaIndonesiaIranIraqIrelandIsraelItalyJamaicaJapanJordanKazakhstanKenyaKoreaKuwaitLaosLatin AmericaLatviaLebanonLiberiaLithuaniaMalaysiaMexicoMicronesiaMiddle AfricaMoldovaMoroccoNepalNetherlandsNicaraguaNigeriaNorth AmericaNorth MacedoniaNorthern AfricaNorthern EuropeNorwayOceaniaPakistanPanamaPeruPhilippinesPolandPortugalRomaniaRussiaSaudi ArabiaScotlandSenegalSerbiaSierra LeoneSingaporeSomaliaSouth AfricaSouth AmericaSouth Central AsiaSouth Eastern AsiaSouthern EuropeSpainSri LankaSt. Vincent and the GrenadinesSudanSwedenSwitzerlandSyriaTaiwanThailandTrinidad and TobagoTurkeyUgandaUkraineUruguayUzbekistanVenezuelaVietnamWest IndiesWestern AfricaWestern AsiaWestern EuropeYemenZaireZimbabweAzores
Immigrants from Albania
Race
Ancestry
AfghanAfricanAlaska NativeAlaskan AthabascanAlbanianAleutAlsatianAmericanApacheArabArapahoArgentineanArmenianAssyrian/Chaldean/SyriacAustralianAustrianBahamianBangladeshiBarbadianBasqueBelgianBelizeanBermudanBhutaneseBlackfeetBolivianBrazilianBritishBritish West IndianBulgarianBurmeseCajunCambodianCanadianCape VerdeanCarpatho RusynCelticCentral AmericanCentral American IndianCherokeeCheyenneChickasawChileanChineseChippewaChoctawColombianColvilleComancheCosta RicanCreeCreekCroatianCrowCubanCypriotCzechCzechoslovakianDanishDelawareDominicanDutchDutch West IndianEastern EuropeanEcuadorianEgyptianEnglishEstonianEthiopianEuropeanFijianFilipinoFinnishFrenchFrench American IndianFrench CanadianGermanGerman RussianGhanaianGreekGuamanian/ChamorroGuatemalanGuyaneseHaitianHmongHonduranHopiHoumaHungarianIcelanderIndian (Asian)IndonesianInupiatIranianIraqiIrishIroquoisIsraeliItalianJamaicanJapaneseJordanianKenyanKiowaKoreanLaotianLatvianLebaneseLiberianLithuanianLumbeeLuxembourgerMacedonianMalaysianMalteseMarshalleseMenomineeMexicanMexican American IndianMongolianMoroccanNative HawaiianNavajoNepaleseNew ZealanderNicaraguanNigerianNorthern EuropeanNorwegianOkinawanOsageOttawaPaiutePakistaniPalestinianPanamanianParaguayanPennsylvania GermanPeruvianPimaPolishPortuguesePotawatomiPuebloPuerto RicanPuget Sound SalishRomanianRussianSalvadoranSamoanScandinavianScotch-IrishScottishSeminoleSenegaleseSerbianShoshoneSierra LeoneanSiouxSlavicSlovakSloveneSomaliSouth AfricanSouth AmericanSouth American IndianSoviet UnionSpaniardSpanishSpanish AmericanSpanish American IndianSri LankanSubsaharan AfricanSudaneseSwedishSwissSyrianTaiwaneseThaiTlingit-HaidaTohono O'OdhamTonganTrinidadian and TobagonianTsimshianTurkishU.S. Virgin IslanderUgandanUkrainianUruguayanUteVenezuelanWelshWest IndianYakamaYaquiYugoslavianYumanYup'ikZimbabwean
Immigration
NonimmigrantsImmigrantsAfghanistanAfricaAlbaniaArgentinaArmeniaAsiaAustraliaAustriaBahamasBangladeshBarbadosBelarusBelgiumBelizeBoliviaBosnia and HerzegovinaBrazilBulgariaBurma/MyanmarCabo VerdeCambodiaCameroonCanadaCaribbeanCentral AmericaChileChinaColombiaCongoCosta RicaCroatiaCubaCzechoslovakiaDenmarkDominicaDominican RepublicEastern AfricaEastern AsiaEastern EuropeEcuadorEgyptEl SalvadorEnglandEritreaEthiopiaEuropeFijiFranceGermanyGhanaGreeceGrenadaGuatemalaGuyanaHaitiHondurasHong KongHungaryIndiaIndonesiaIranIraqIrelandIsraelItalyJamaicaJapanJordanKazakhstanKenyaKoreaKuwaitLaosLatin AmericaLatviaLebanonLiberiaLithuaniaMalaysiaMexicoMicronesiaMiddle AfricaMoldovaMoroccoNepalNetherlandsNicaraguaNigeriaNorth AmericaNorth MacedoniaNorthern AfricaNorthern EuropeNorwayOceaniaPakistanPanamaPeruPhilippinesPolandPortugalRomaniaRussiaSaudi ArabiaScotlandSenegalSerbiaSierra LeoneSingaporeSomaliaSouth AfricaSouth AmericaSouth Central AsiaSouth Eastern AsiaSouthern EuropeSpainSri LankaSt. Vincent and the GrenadinesSudanSwedenSwitzerlandSyriaTaiwanThailandTrinidad and TobagoTurkeyUgandaUkraineUruguayUzbekistanVenezuelaVietnamWest IndiesWestern AfricaWestern AsiaWestern EuropeYemenZaireZimbabweAzores
Hearing Disability
Income
Poverty
Unemployment
Labor Participation
Family Structure
Vehicle Availability
Education Level
Disability

Hearing Disability Comparison

Vietnamese

Immigrants from Albania

Exceptional
Excellent
2.4%
HEARING DISABILITY
100.0/ 100
METRIC RATING
6th/ 347
METRIC RANK
2.9%
HEARING DISABILITY
88.5/ 100
METRIC RATING
125th/ 347
METRIC RANK

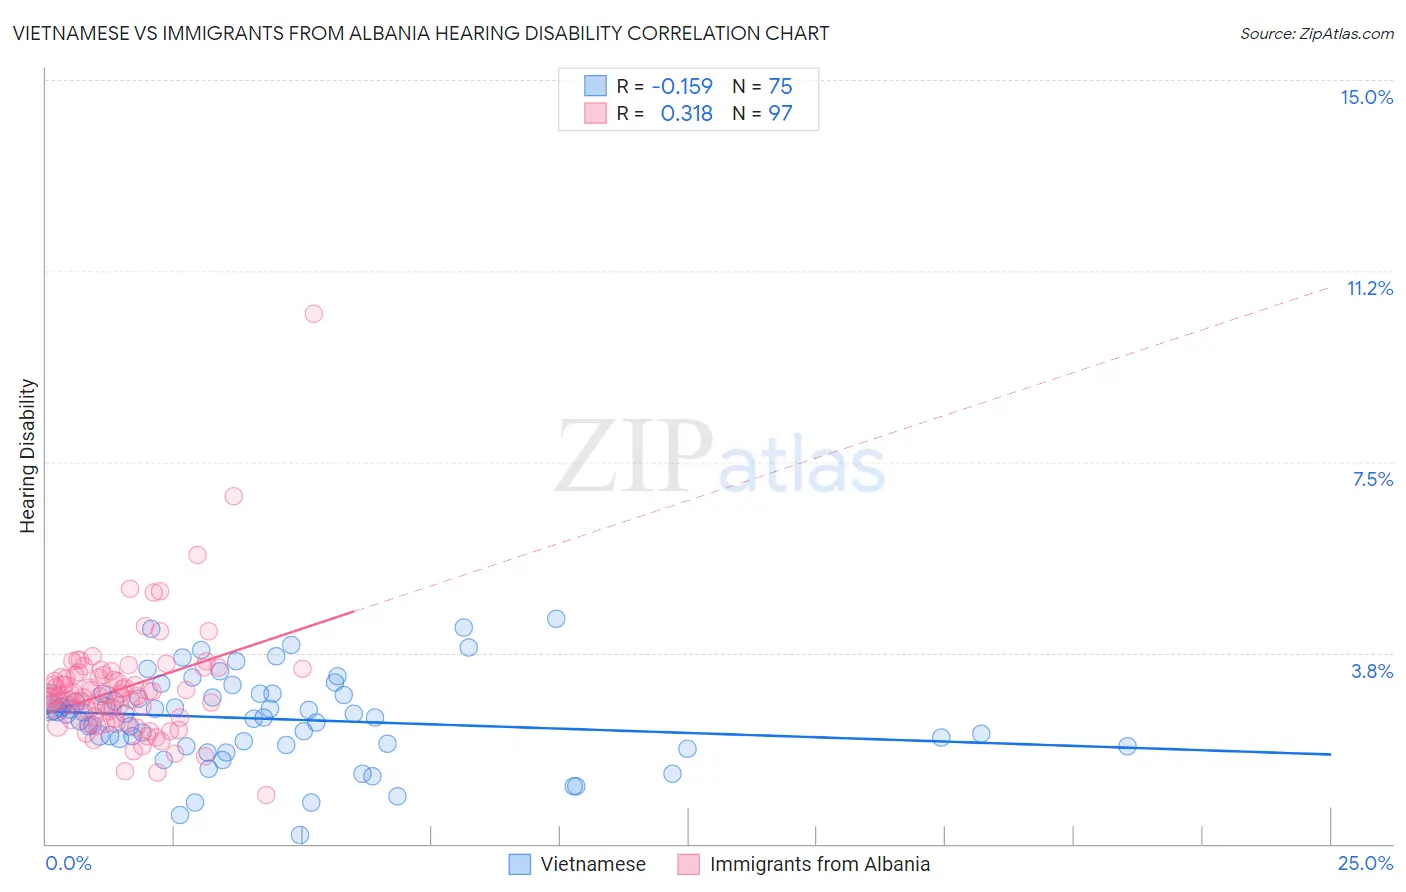
Vietnamese vs Immigrants from Albania Hearing Disability Correlation Chart

The statistical analysis conducted on geographies consisting of 170,714,585 people shows a poor negative correlation between the proportion of Vietnamese and percentage of population with hearing disability in the United States with a correlation coefficient (R) of -0.159 and weighted average of 2.4%. Similarly, the statistical analysis conducted on geographies consisting of 119,393,957 people shows a mild positive correlation between the proportion of Immigrants from Albania and percentage of population with hearing disability in the United States with a correlation coefficient (R) of 0.318 and weighted average of 2.9%, a difference of 19.4%.
Vietnamese vs Immigrants from Albania Hearing Disability

Hearing Disability Correlation Summary

MeasurementVietnameseImmigrants from Albania
Minimum0.18%0.95%
Maximum4.4%10.4%
Range4.2%9.5%
Mean2.5%3.0%
Median2.6%2.9%
Interquartile 25% (IQ1)1.9%2.5%
Interquartile 75% (IQ3)2.9%3.3%
Interquartile Range (IQR)0.99%0.85%
Standard Deviation (Sample)0.87%1.1%
Standard Deviation (Population)0.87%1.1%

Similar Demographics by Hearing Disability

Demographics Similar to Vietnamese by Hearing Disability

In terms of hearing disability, the demographic groups most similar to Vietnamese are Immigrants from Barbados (2.4%, a difference of 1.1%), Immigrants from Bangladesh (2.4%, a difference of 1.6%), British West Indian (2.4%, a difference of 1.8%), Immigrants from Dominican Republic (2.4%, a difference of 2.6%), and Immigrants from Guyana (2.3%, a difference of 3.0%).
DemographicsRating | RankHearing Disability
Immigrants | Grenada
100.0
/100
|
#1
Exceptional
2.2%
Immigrants | St. Vincent and the Grenadines
100.0
/100
|
#2
Exceptional
2.3%
Guyanese
100.0
/100
|
#3
Exceptional
2.3%
Immigrants | Guyana
100.0
/100
|
#4
Exceptional
2.3%
Immigrants | Barbados
100.0
/100
|
#5
Exceptional
2.4%
Vietnamese
100.0
/100
|
#6
Exceptional
2.4%
Immigrants | Bangladesh
100.0
/100
|
#7
Exceptional
2.4%
British West Indians
100.0
/100
|
#8
Exceptional
2.4%
Immigrants | Dominican Republic
100.0
/100
|
#9
Exceptional
2.4%
Immigrants | Ecuador
99.9
/100
|
#10
Exceptional
2.5%
Immigrants | Trinidad and Tobago
99.9
/100
|
#11
Exceptional
2.5%
Trinidadians and Tobagonians
99.9
/100
|
#12
Exceptional
2.5%
Sierra Leoneans
99.9
/100
|
#13
Exceptional
2.5%
Ecuadorians
99.9
/100
|
#14
Exceptional
2.5%
Barbadians
99.9
/100
|
#15
Exceptional
2.5%

Demographics Similar to Immigrants from Albania by Hearing Disability

In terms of hearing disability, the demographic groups most similar to Immigrants from Albania are Immigrants from Zaire (2.9%, a difference of 0.030%), Bahamian (2.9%, a difference of 0.030%), Liberian (2.8%, a difference of 0.13%), Immigrants from Sudan (2.9%, a difference of 0.16%), and Cuban (2.8%, a difference of 0.22%).
DemographicsRating | RankHearing Disability
Zimbabweans
89.9
/100
|
#118
Excellent
2.8%
Kenyans
89.8
/100
|
#119
Excellent
2.8%
Jordanians
89.5
/100
|
#120
Excellent
2.8%
Cubans
89.4
/100
|
#121
Excellent
2.8%
Liberians
89.0
/100
|
#122
Excellent
2.8%
Immigrants | Zaire
88.6
/100
|
#123
Excellent
2.9%
Bahamians
88.6
/100
|
#124
Excellent
2.9%
Immigrants | Albania
88.5
/100
|
#125
Excellent
2.9%
Immigrants | Sudan
87.8
/100
|
#126
Excellent
2.9%
South American Indians
86.9
/100
|
#127
Excellent
2.9%
Immigrants | Western Asia
86.9
/100
|
#128
Excellent
2.9%
Immigrants | Uganda
86.6
/100
|
#129
Excellent
2.9%
Immigrants | Vietnam
86.5
/100
|
#130
Excellent
2.9%
Immigrants | Kenya
86.1
/100
|
#131
Excellent
2.9%
Chileans
85.8
/100
|
#132
Excellent
2.9%