White/Caucasian vs Immigrants from Albania Hearing Disability
COMPARE
White/Caucasian
Immigrants from Albania
Hearing Disability
Hearing Disability Comparison
Whites/Caucasians
Immigrants from Albania
3.7%
HEARING DISABILITY
0.0/ 100
METRIC RATING
290th/ 347
METRIC RANK
2.9%
HEARING DISABILITY
88.5/ 100
METRIC RATING
125th/ 347
METRIC RANK
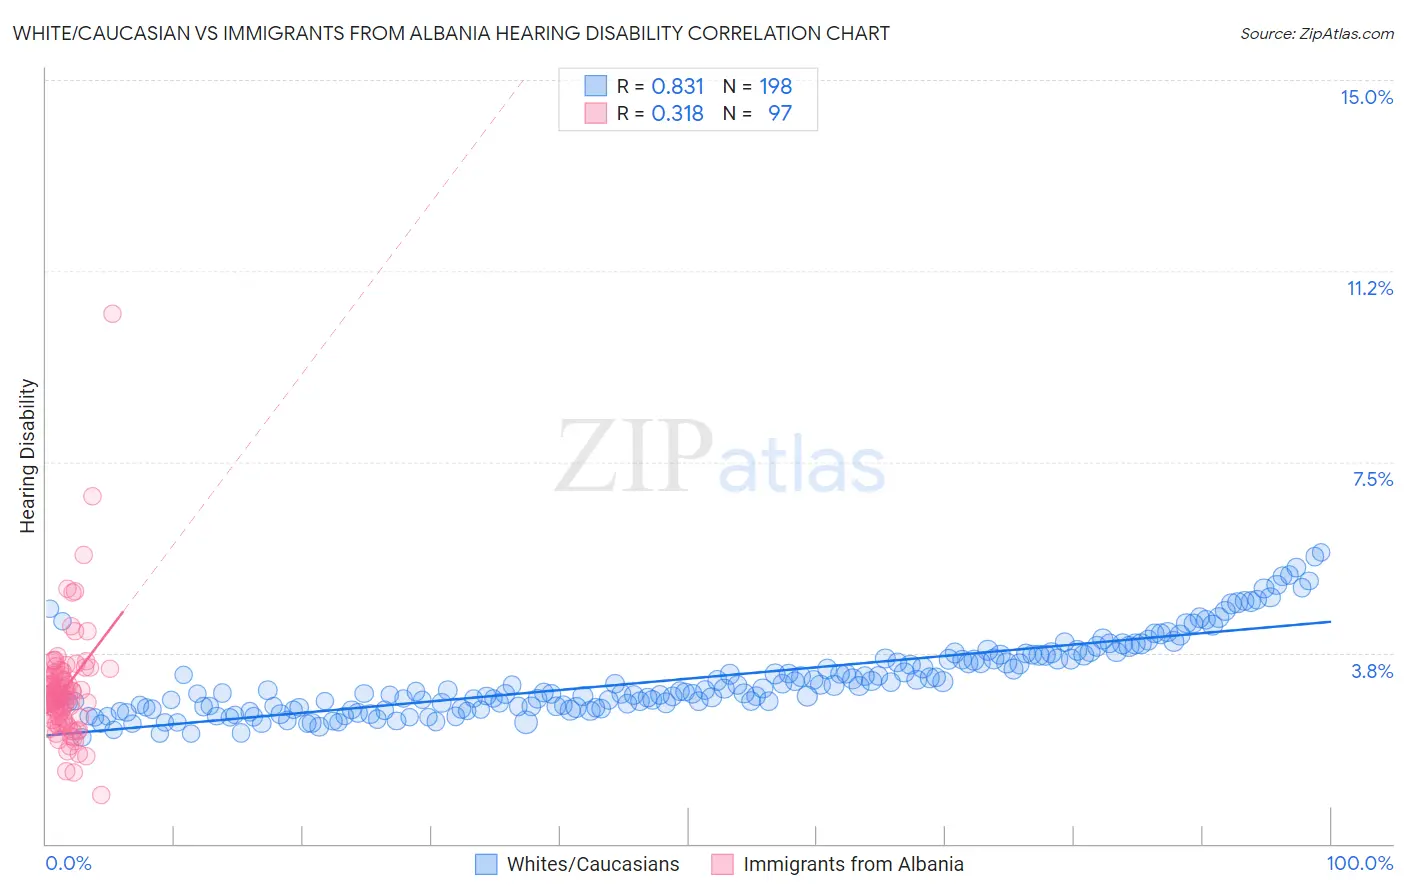
White/Caucasian vs Immigrants from Albania Hearing Disability Correlation Chart
The statistical analysis conducted on geographies consisting of 582,250,050 people shows a very strong positive correlation between the proportion of Whites/Caucasians and percentage of population with hearing disability in the United States with a correlation coefficient (R) of 0.831 and weighted average of 3.7%. Similarly, the statistical analysis conducted on geographies consisting of 119,393,957 people shows a mild positive correlation between the proportion of Immigrants from Albania and percentage of population with hearing disability in the United States with a correlation coefficient (R) of 0.318 and weighted average of 2.9%, a difference of 29.2%.
Hearing Disability Correlation Summary
| Measurement | White/Caucasian | Immigrants from Albania |
| Minimum | 2.1% | 0.95% |
| Maximum | 5.7% | 10.4% |
| Range | 3.6% | 9.5% |
| Mean | 3.2% | 3.0% |
| Median | 3.0% | 2.9% |
| Interquartile 25% (IQ1) | 2.7% | 2.5% |
| Interquartile 75% (IQ3) | 3.7% | 3.3% |
| Interquartile Range (IQR) | 1.0% | 0.85% |
| Standard Deviation (Sample) | 0.77% | 1.1% |
| Standard Deviation (Population) | 0.77% | 1.1% |
Similar Demographics by Hearing Disability
Demographics Similar to Whites/Caucasians by Hearing Disability
In terms of hearing disability, the demographic groups most similar to Whites/Caucasians are Finnish (3.7%, a difference of 0.010%), Native Hawaiian (3.7%, a difference of 0.080%), Chinese (3.7%, a difference of 0.13%), Norwegian (3.7%, a difference of 0.13%), and Irish (3.7%, a difference of 0.34%).
| Demographics | Rating | Rank | Hearing Disability |
| Blackfeet | 0.0 /100 | #283 | Tragic 3.6% |
| Immigrants | Micronesia | 0.0 /100 | #284 | Tragic 3.6% |
| Sioux | 0.0 /100 | #285 | Tragic 3.6% |
| Delaware | 0.0 /100 | #286 | Tragic 3.6% |
| Spanish | 0.0 /100 | #287 | Tragic 3.7% |
| Irish | 0.0 /100 | #288 | Tragic 3.7% |
| Chinese | 0.0 /100 | #289 | Tragic 3.7% |
| Whites/Caucasians | 0.0 /100 | #290 | Tragic 3.7% |
| Finns | 0.0 /100 | #291 | Tragic 3.7% |
| Native Hawaiians | 0.0 /100 | #292 | Tragic 3.7% |
| Norwegians | 0.0 /100 | #293 | Tragic 3.7% |
| Iroquois | 0.0 /100 | #294 | Tragic 3.7% |
| Welsh | 0.0 /100 | #295 | Tragic 3.7% |
| Pima | 0.0 /100 | #296 | Tragic 3.7% |
| Immigrants | Azores | 0.0 /100 | #297 | Tragic 3.7% |
Demographics Similar to Immigrants from Albania by Hearing Disability
In terms of hearing disability, the demographic groups most similar to Immigrants from Albania are Immigrants from Zaire (2.9%, a difference of 0.030%), Bahamian (2.9%, a difference of 0.030%), Liberian (2.8%, a difference of 0.13%), Immigrants from Sudan (2.9%, a difference of 0.16%), and Cuban (2.8%, a difference of 0.22%).
| Demographics | Rating | Rank | Hearing Disability |
| Zimbabweans | 89.9 /100 | #118 | Excellent 2.8% |
| Kenyans | 89.8 /100 | #119 | Excellent 2.8% |
| Jordanians | 89.5 /100 | #120 | Excellent 2.8% |
| Cubans | 89.4 /100 | #121 | Excellent 2.8% |
| Liberians | 89.0 /100 | #122 | Excellent 2.8% |
| Immigrants | Zaire | 88.6 /100 | #123 | Excellent 2.9% |
| Bahamians | 88.6 /100 | #124 | Excellent 2.9% |
| Immigrants | Albania | 88.5 /100 | #125 | Excellent 2.9% |
| Immigrants | Sudan | 87.8 /100 | #126 | Excellent 2.9% |
| South American Indians | 86.9 /100 | #127 | Excellent 2.9% |
| Immigrants | Western Asia | 86.9 /100 | #128 | Excellent 2.9% |
| Immigrants | Uganda | 86.6 /100 | #129 | Excellent 2.9% |
| Immigrants | Vietnam | 86.5 /100 | #130 | Excellent 2.9% |
| Immigrants | Kenya | 86.1 /100 | #131 | Excellent 2.9% |
| Chileans | 85.8 /100 | #132 | Excellent 2.9% |