Burmese vs Luxembourger Male Disability
COMPARE
Burmese
Luxembourger
Male Disability
Male Disability Comparison
Burmese
Luxembourgers
10.0%
MALE DISABILITY
100.0/ 100
METRIC RATING
21st/ 347
METRIC RANK
11.1%
MALE DISABILITY
61.9/ 100
METRIC RATING
165th/ 347
METRIC RANK
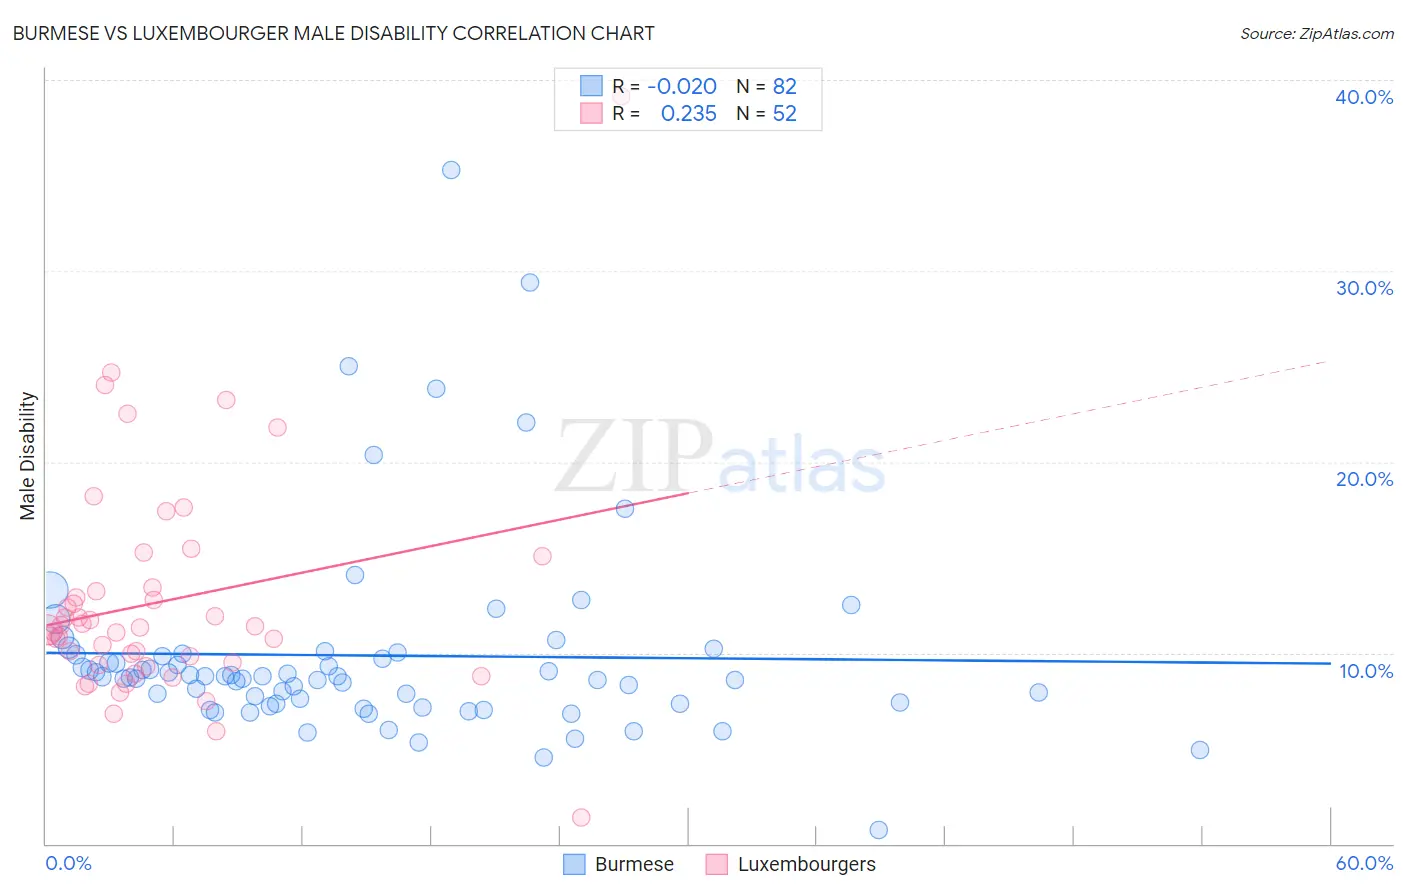
Burmese vs Luxembourger Male Disability Correlation Chart
The statistical analysis conducted on geographies consisting of 465,271,159 people shows no correlation between the proportion of Burmese and percentage of males with a disability in the United States with a correlation coefficient (R) of -0.020 and weighted average of 10.0%. Similarly, the statistical analysis conducted on geographies consisting of 144,678,542 people shows a weak positive correlation between the proportion of Luxembourgers and percentage of males with a disability in the United States with a correlation coefficient (R) of 0.235 and weighted average of 11.1%, a difference of 11.7%.
Male Disability Correlation Summary
| Measurement | Burmese | Luxembourger |
| Minimum | 0.74% | 1.4% |
| Maximum | 35.3% | 39.1% |
| Range | 34.6% | 37.8% |
| Mean | 9.9% | 12.7% |
| Median | 8.8% | 11.3% |
| Interquartile 25% (IQ1) | 7.3% | 9.4% |
| Interquartile 75% (IQ3) | 9.9% | 13.3% |
| Interquartile Range (IQR) | 2.6% | 3.9% |
| Standard Deviation (Sample) | 5.2% | 6.0% |
| Standard Deviation (Population) | 5.2% | 5.9% |
Similar Demographics by Male Disability
Demographics Similar to Burmese by Male Disability
In terms of male disability, the demographic groups most similar to Burmese are Asian (10.0%, a difference of 0.11%), Immigrants from Sri Lanka (10.0%, a difference of 0.16%), Immigrants from Venezuela (10.0%, a difference of 0.29%), Cypriot (10.0%, a difference of 0.38%), and Immigrants from Asia (10.0%, a difference of 0.51%).
| Demographics | Rating | Rank | Male Disability |
| Immigrants | Iran | 100.0 /100 | #14 | Exceptional 9.7% |
| Indians (Asian) | 100.0 /100 | #15 | Exceptional 9.7% |
| Okinawans | 100.0 /100 | #16 | Exceptional 9.8% |
| Immigrants | Korea | 100.0 /100 | #17 | Exceptional 9.8% |
| Immigrants | Pakistan | 100.0 /100 | #18 | Exceptional 9.8% |
| Immigrants | Sri Lanka | 100.0 /100 | #19 | Exceptional 10.0% |
| Asians | 100.0 /100 | #20 | Exceptional 10.0% |
| Burmese | 100.0 /100 | #21 | Exceptional 10.0% |
| Immigrants | Venezuela | 100.0 /100 | #22 | Exceptional 10.0% |
| Cypriots | 100.0 /100 | #23 | Exceptional 10.0% |
| Immigrants | Asia | 100.0 /100 | #24 | Exceptional 10.0% |
| Immigrants | Malaysia | 99.9 /100 | #25 | Exceptional 10.0% |
| Paraguayans | 99.9 /100 | #26 | Exceptional 10.1% |
| Egyptians | 99.9 /100 | #27 | Exceptional 10.1% |
| Vietnamese | 99.9 /100 | #28 | Exceptional 10.1% |
Demographics Similar to Luxembourgers by Male Disability
In terms of male disability, the demographic groups most similar to Luxembourgers are Immigrants from Hungary (11.1%, a difference of 0.040%), British West Indian (11.1%, a difference of 0.050%), Immigrants from Kenya (11.1%, a difference of 0.11%), Immigrants from Haiti (11.1%, a difference of 0.20%), and Immigrants from West Indies (11.1%, a difference of 0.23%).
| Demographics | Rating | Rank | Male Disability |
| Latvians | 68.1 /100 | #158 | Good 11.1% |
| Guatemalans | 67.2 /100 | #159 | Good 11.1% |
| Albanians | 66.5 /100 | #160 | Good 11.1% |
| Immigrants | West Indies | 65.7 /100 | #161 | Good 11.1% |
| Immigrants | Haiti | 65.3 /100 | #162 | Good 11.1% |
| Immigrants | Kenya | 63.8 /100 | #163 | Good 11.1% |
| British West Indians | 62.8 /100 | #164 | Good 11.1% |
| Luxembourgers | 61.9 /100 | #165 | Good 11.1% |
| Immigrants | Hungary | 61.2 /100 | #166 | Good 11.1% |
| Immigrants | Southern Europe | 54.4 /100 | #167 | Average 11.2% |
| Immigrants | Latin America | 54.0 /100 | #168 | Average 11.2% |
| Barbadians | 53.4 /100 | #169 | Average 11.2% |
| New Zealanders | 52.9 /100 | #170 | Average 11.2% |
| Haitians | 52.5 /100 | #171 | Average 11.2% |
| Romanians | 50.7 /100 | #172 | Average 11.2% |