Afghan vs Italian Hearing Disability
COMPARE
Afghan
Italian
Hearing Disability
Hearing Disability Comparison
Afghans
Italians
2.7%
HEARING DISABILITY
97.6/ 100
METRIC RATING
72nd/ 347
METRIC RANK
3.4%
HEARING DISABILITY
0.4/ 100
METRIC RATING
249th/ 347
METRIC RANK
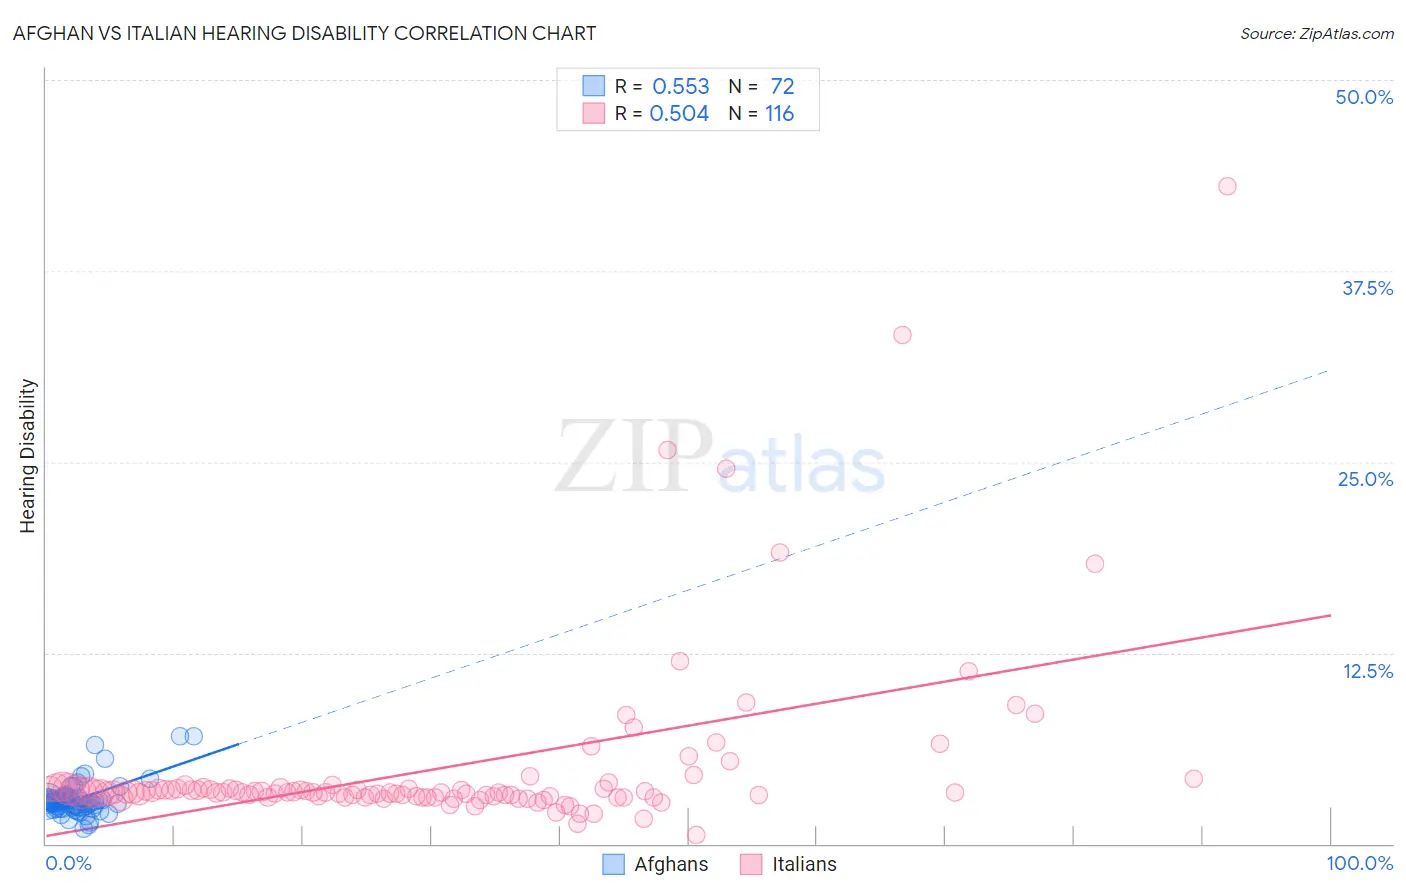
Afghan vs Italian Hearing Disability Correlation Chart
The statistical analysis conducted on geographies consisting of 148,839,750 people shows a substantial positive correlation between the proportion of Afghans and percentage of population with hearing disability in the United States with a correlation coefficient (R) of 0.553 and weighted average of 2.7%. Similarly, the statistical analysis conducted on geographies consisting of 574,261,406 people shows a substantial positive correlation between the proportion of Italians and percentage of population with hearing disability in the United States with a correlation coefficient (R) of 0.504 and weighted average of 3.4%, a difference of 23.5%.
Hearing Disability Correlation Summary
| Measurement | Afghan | Italian |
| Minimum | 0.95% | 0.61% |
| Maximum | 7.1% | 43.0% |
| Range | 6.1% | 42.4% |
| Mean | 2.9% | 5.0% |
| Median | 2.7% | 3.4% |
| Interquartile 25% (IQ1) | 2.4% | 3.1% |
| Interquartile 75% (IQ3) | 3.0% | 3.6% |
| Interquartile Range (IQR) | 0.55% | 0.52% |
| Standard Deviation (Sample) | 1.1% | 5.9% |
| Standard Deviation (Population) | 1.1% | 5.8% |
Similar Demographics by Hearing Disability
Demographics Similar to Afghans by Hearing Disability
In terms of hearing disability, the demographic groups most similar to Afghans are Argentinean (2.7%, a difference of 0.080%), Immigrants from Korea (2.7%, a difference of 0.080%), Central American (2.7%, a difference of 0.10%), Immigrants from Saudi Arabia (2.7%, a difference of 0.11%), and Asian (2.7%, a difference of 0.11%).
| Demographics | Rating | Rank | Hearing Disability |
| Immigrants | Nepal | 98.3 /100 | #65 | Exceptional 2.7% |
| Immigrants | Belize | 98.2 /100 | #66 | Exceptional 2.7% |
| Egyptians | 98.1 /100 | #67 | Exceptional 2.7% |
| Immigrants | Africa | 98.0 /100 | #68 | Exceptional 2.7% |
| Nicaraguans | 97.9 /100 | #69 | Exceptional 2.7% |
| Peruvians | 97.7 /100 | #70 | Exceptional 2.7% |
| Central Americans | 97.7 /100 | #71 | Exceptional 2.7% |
| Afghans | 97.6 /100 | #72 | Exceptional 2.7% |
| Argentineans | 97.5 /100 | #73 | Exceptional 2.7% |
| Immigrants | Korea | 97.5 /100 | #74 | Exceptional 2.7% |
| Immigrants | Saudi Arabia | 97.5 /100 | #75 | Exceptional 2.7% |
| Asians | 97.5 /100 | #76 | Exceptional 2.7% |
| Immigrants | Malaysia | 97.5 /100 | #77 | Exceptional 2.7% |
| Mongolians | 97.4 /100 | #78 | Exceptional 2.7% |
| Colombians | 97.4 /100 | #79 | Exceptional 2.7% |
Demographics Similar to Italians by Hearing Disability
In terms of hearing disability, the demographic groups most similar to Italians are Yuman (3.4%, a difference of 0.010%), Hungarian (3.4%, a difference of 0.24%), Croatian (3.4%, a difference of 0.45%), Austrian (3.4%, a difference of 0.53%), and Lithuanian (3.4%, a difference of 0.75%).
| Demographics | Rating | Rank | Hearing Disability |
| Yugoslavians | 1.0 /100 | #242 | Tragic 3.3% |
| Immigrants | Western Europe | 1.0 /100 | #243 | Tragic 3.3% |
| Assyrians/Chaldeans/Syriacs | 0.9 /100 | #244 | Tragic 3.3% |
| Immigrants | Scotland | 0.8 /100 | #245 | Tragic 3.3% |
| Immigrants | England | 0.7 /100 | #246 | Tragic 3.3% |
| Lithuanians | 0.6 /100 | #247 | Tragic 3.4% |
| Austrians | 0.6 /100 | #248 | Tragic 3.4% |
| Italians | 0.4 /100 | #249 | Tragic 3.4% |
| Yuman | 0.4 /100 | #250 | Tragic 3.4% |
| Hungarians | 0.4 /100 | #251 | Tragic 3.4% |
| Croatians | 0.4 /100 | #252 | Tragic 3.4% |
| Carpatho Rusyns | 0.3 /100 | #253 | Tragic 3.4% |
| Slavs | 0.2 /100 | #254 | Tragic 3.4% |
| Poles | 0.2 /100 | #255 | Tragic 3.4% |
| Hmong | 0.2 /100 | #256 | Tragic 3.4% |