Bulgarian vs Immigrants from Kenya Cognitive Disability
COMPARE
Bulgarian
Immigrants from Kenya
Cognitive Disability
Cognitive Disability Comparison
Bulgarians
Immigrants from Kenya
16.3%
COGNITIVE DISABILITY
100.0/ 100
METRIC RATING
20th/ 347
METRIC RANK
18.3%
COGNITIVE DISABILITY
0.0/ 100
METRIC RATING
303rd/ 347
METRIC RANK
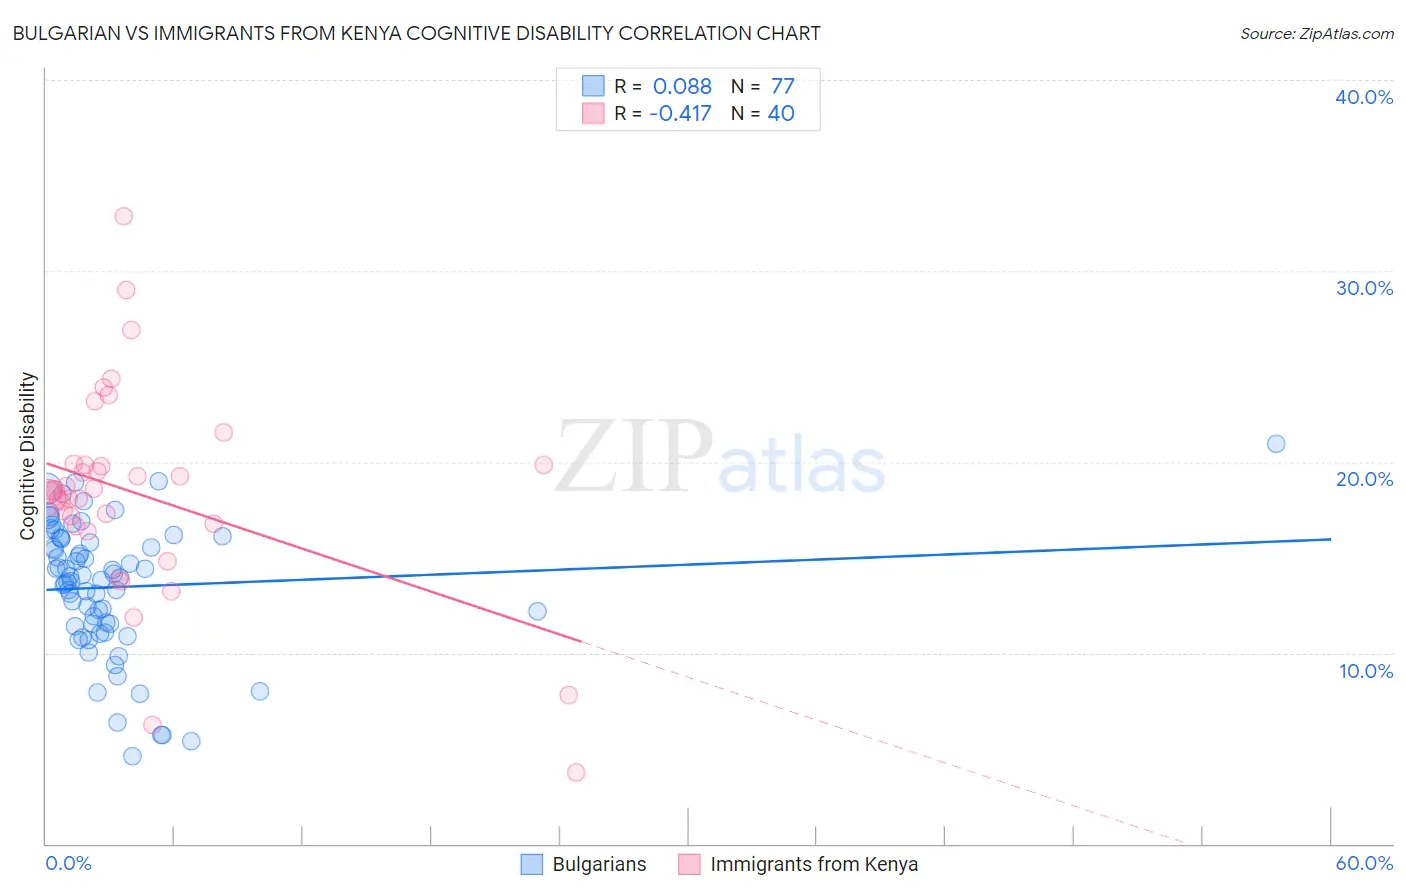
Bulgarian vs Immigrants from Kenya Cognitive Disability Correlation Chart
The statistical analysis conducted on geographies consisting of 205,630,797 people shows a slight positive correlation between the proportion of Bulgarians and percentage of population with cognitive disability in the United States with a correlation coefficient (R) of 0.088 and weighted average of 16.3%. Similarly, the statistical analysis conducted on geographies consisting of 218,057,168 people shows a moderate negative correlation between the proportion of Immigrants from Kenya and percentage of population with cognitive disability in the United States with a correlation coefficient (R) of -0.417 and weighted average of 18.3%, a difference of 12.1%.
Cognitive Disability Correlation Summary
| Measurement | Bulgarian | Immigrants from Kenya |
| Minimum | 4.6% | 3.7% |
| Maximum | 20.9% | 32.8% |
| Range | 16.4% | 29.1% |
| Mean | 13.4% | 18.3% |
| Median | 14.0% | 18.5% |
| Interquartile 25% (IQ1) | 11.4% | 16.7% |
| Interquartile 75% (IQ3) | 16.0% | 19.8% |
| Interquartile Range (IQR) | 4.6% | 3.1% |
| Standard Deviation (Sample) | 3.4% | 5.4% |
| Standard Deviation (Population) | 3.4% | 5.3% |
Similar Demographics by Cognitive Disability
Demographics Similar to Bulgarians by Cognitive Disability
In terms of cognitive disability, the demographic groups most similar to Bulgarians are Immigrants from Bolivia (16.3%, a difference of 0.010%), Immigrants from Northern Europe (16.3%, a difference of 0.020%), Immigrants from Cuba (16.3%, a difference of 0.040%), Immigrants from North Macedonia (16.3%, a difference of 0.080%), and Eastern European (16.3%, a difference of 0.10%).
| Demographics | Rating | Rank | Cognitive Disability |
| Lithuanians | 100.0 /100 | #13 | Exceptional 16.3% |
| Immigrants | Austria | 100.0 /100 | #14 | Exceptional 16.3% |
| Immigrants | Greece | 100.0 /100 | #15 | Exceptional 16.3% |
| Eastern Europeans | 100.0 /100 | #16 | Exceptional 16.3% |
| Immigrants | North Macedonia | 100.0 /100 | #17 | Exceptional 16.3% |
| Immigrants | Northern Europe | 100.0 /100 | #18 | Exceptional 16.3% |
| Immigrants | Bolivia | 100.0 /100 | #19 | Exceptional 16.3% |
| Bulgarians | 100.0 /100 | #20 | Exceptional 16.3% |
| Immigrants | Cuba | 100.0 /100 | #21 | Exceptional 16.3% |
| Immigrants | South Central Asia | 99.9 /100 | #22 | Exceptional 16.4% |
| Croatians | 99.9 /100 | #23 | Exceptional 16.4% |
| Immigrants | Argentina | 99.9 /100 | #24 | Exceptional 16.4% |
| Luxembourgers | 99.9 /100 | #25 | Exceptional 16.4% |
| Immigrants | Croatia | 99.9 /100 | #26 | Exceptional 16.4% |
| Immigrants | Pakistan | 99.9 /100 | #27 | Exceptional 16.4% |
Demographics Similar to Immigrants from Kenya by Cognitive Disability
In terms of cognitive disability, the demographic groups most similar to Immigrants from Kenya are Barbadian (18.3%, a difference of 0.010%), Immigrants from Eritrea (18.3%, a difference of 0.050%), Immigrants from Ghana (18.3%, a difference of 0.090%), Colville (18.3%, a difference of 0.17%), and Seminole (18.3%, a difference of 0.18%).
| Demographics | Rating | Rank | Cognitive Disability |
| Immigrants | Burma/Myanmar | 0.0 /100 | #296 | Tragic 18.2% |
| Blackfeet | 0.0 /100 | #297 | Tragic 18.3% |
| Japanese | 0.0 /100 | #298 | Tragic 18.3% |
| Ghanaians | 0.0 /100 | #299 | Tragic 18.3% |
| Creek | 0.0 /100 | #300 | Tragic 18.3% |
| Immigrants | Ghana | 0.0 /100 | #301 | Tragic 18.3% |
| Barbadians | 0.0 /100 | #302 | Tragic 18.3% |
| Immigrants | Kenya | 0.0 /100 | #303 | Tragic 18.3% |
| Immigrants | Eritrea | 0.0 /100 | #304 | Tragic 18.3% |
| Colville | 0.0 /100 | #305 | Tragic 18.3% |
| Seminole | 0.0 /100 | #306 | Tragic 18.3% |
| Ugandans | 0.0 /100 | #307 | Tragic 18.3% |
| Immigrants | Western Africa | 0.0 /100 | #308 | Tragic 18.4% |
| Immigrants | Eastern Africa | 0.0 /100 | #309 | Tragic 18.4% |
| Choctaw | 0.0 /100 | #310 | Tragic 18.4% |