Immigrants from Northern Europe vs Immigrants from Kenya Cognitive Disability
COMPARE
Immigrants from Northern Europe
Immigrants from Kenya
Cognitive Disability
Cognitive Disability Comparison
Immigrants from Northern Europe
Immigrants from Kenya
16.3%
COGNITIVE DISABILITY
100.0/ 100
METRIC RATING
18th/ 347
METRIC RANK
18.3%
COGNITIVE DISABILITY
0.0/ 100
METRIC RATING
303rd/ 347
METRIC RANK
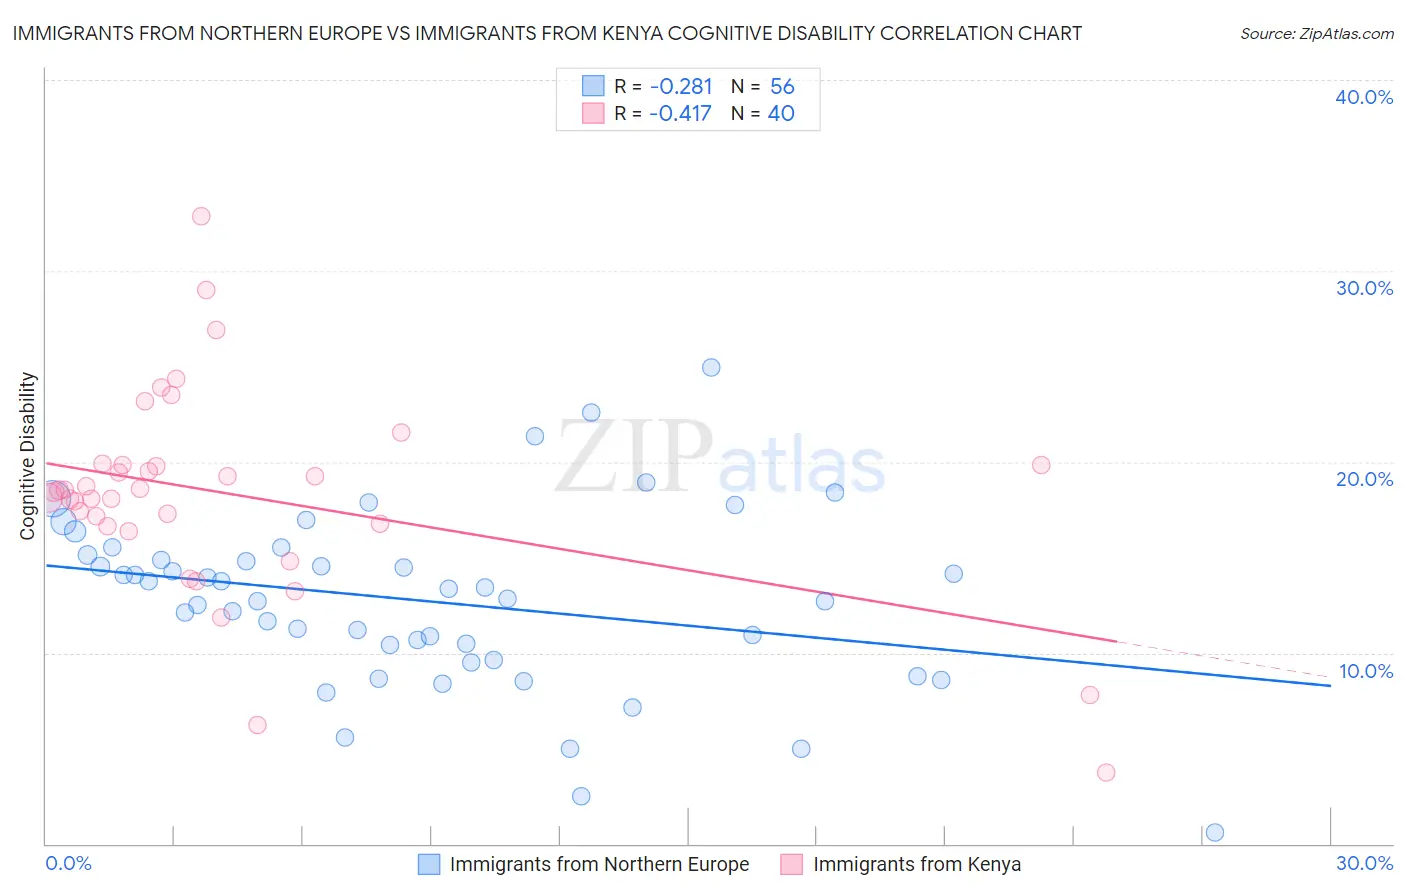
Immigrants from Northern Europe vs Immigrants from Kenya Cognitive Disability Correlation Chart
The statistical analysis conducted on geographies consisting of 477,209,929 people shows a weak negative correlation between the proportion of Immigrants from Northern Europe and percentage of population with cognitive disability in the United States with a correlation coefficient (R) of -0.281 and weighted average of 16.3%. Similarly, the statistical analysis conducted on geographies consisting of 218,057,168 people shows a moderate negative correlation between the proportion of Immigrants from Kenya and percentage of population with cognitive disability in the United States with a correlation coefficient (R) of -0.417 and weighted average of 18.3%, a difference of 12.1%.
Cognitive Disability Correlation Summary
| Measurement | Immigrants from Northern Europe | Immigrants from Kenya |
| Minimum | 0.61% | 3.7% |
| Maximum | 24.9% | 32.8% |
| Range | 24.3% | 29.1% |
| Mean | 12.7% | 18.3% |
| Median | 13.1% | 18.5% |
| Interquartile 25% (IQ1) | 10.0% | 16.7% |
| Interquartile 75% (IQ3) | 15.0% | 19.8% |
| Interquartile Range (IQR) | 5.0% | 3.1% |
| Standard Deviation (Sample) | 4.6% | 5.4% |
| Standard Deviation (Population) | 4.6% | 5.3% |
Similar Demographics by Cognitive Disability
Demographics Similar to Immigrants from Northern Europe by Cognitive Disability
In terms of cognitive disability, the demographic groups most similar to Immigrants from Northern Europe are Immigrants from Bolivia (16.3%, a difference of 0.0%), Bulgarian (16.3%, a difference of 0.020%), Immigrants from North Macedonia (16.3%, a difference of 0.060%), Immigrants from Cuba (16.3%, a difference of 0.060%), and Eastern European (16.3%, a difference of 0.080%).
| Demographics | Rating | Rank | Cognitive Disability |
| Immigrants | Czechoslovakia | 100.0 /100 | #11 | Exceptional 16.2% |
| Maltese | 100.0 /100 | #12 | Exceptional 16.2% |
| Lithuanians | 100.0 /100 | #13 | Exceptional 16.3% |
| Immigrants | Austria | 100.0 /100 | #14 | Exceptional 16.3% |
| Immigrants | Greece | 100.0 /100 | #15 | Exceptional 16.3% |
| Eastern Europeans | 100.0 /100 | #16 | Exceptional 16.3% |
| Immigrants | North Macedonia | 100.0 /100 | #17 | Exceptional 16.3% |
| Immigrants | Northern Europe | 100.0 /100 | #18 | Exceptional 16.3% |
| Immigrants | Bolivia | 100.0 /100 | #19 | Exceptional 16.3% |
| Bulgarians | 100.0 /100 | #20 | Exceptional 16.3% |
| Immigrants | Cuba | 100.0 /100 | #21 | Exceptional 16.3% |
| Immigrants | South Central Asia | 99.9 /100 | #22 | Exceptional 16.4% |
| Croatians | 99.9 /100 | #23 | Exceptional 16.4% |
| Immigrants | Argentina | 99.9 /100 | #24 | Exceptional 16.4% |
| Luxembourgers | 99.9 /100 | #25 | Exceptional 16.4% |
Demographics Similar to Immigrants from Kenya by Cognitive Disability
In terms of cognitive disability, the demographic groups most similar to Immigrants from Kenya are Barbadian (18.3%, a difference of 0.010%), Immigrants from Eritrea (18.3%, a difference of 0.050%), Immigrants from Ghana (18.3%, a difference of 0.090%), Colville (18.3%, a difference of 0.17%), and Seminole (18.3%, a difference of 0.18%).
| Demographics | Rating | Rank | Cognitive Disability |
| Immigrants | Burma/Myanmar | 0.0 /100 | #296 | Tragic 18.2% |
| Blackfeet | 0.0 /100 | #297 | Tragic 18.3% |
| Japanese | 0.0 /100 | #298 | Tragic 18.3% |
| Ghanaians | 0.0 /100 | #299 | Tragic 18.3% |
| Creek | 0.0 /100 | #300 | Tragic 18.3% |
| Immigrants | Ghana | 0.0 /100 | #301 | Tragic 18.3% |
| Barbadians | 0.0 /100 | #302 | Tragic 18.3% |
| Immigrants | Kenya | 0.0 /100 | #303 | Tragic 18.3% |
| Immigrants | Eritrea | 0.0 /100 | #304 | Tragic 18.3% |
| Colville | 0.0 /100 | #305 | Tragic 18.3% |
| Seminole | 0.0 /100 | #306 | Tragic 18.3% |
| Ugandans | 0.0 /100 | #307 | Tragic 18.3% |
| Immigrants | Western Africa | 0.0 /100 | #308 | Tragic 18.4% |
| Immigrants | Eastern Africa | 0.0 /100 | #309 | Tragic 18.4% |
| Choctaw | 0.0 /100 | #310 | Tragic 18.4% |