Bulgarian vs Cuban Cognitive Disability
COMPARE
Bulgarian
Cuban
Cognitive Disability
Cognitive Disability Comparison
Bulgarians
Cubans
16.3%
COGNITIVE DISABILITY
100.0/ 100
METRIC RATING
20th/ 347
METRIC RANK
16.5%
COGNITIVE DISABILITY
99.9/ 100
METRIC RATING
41st/ 347
METRIC RANK
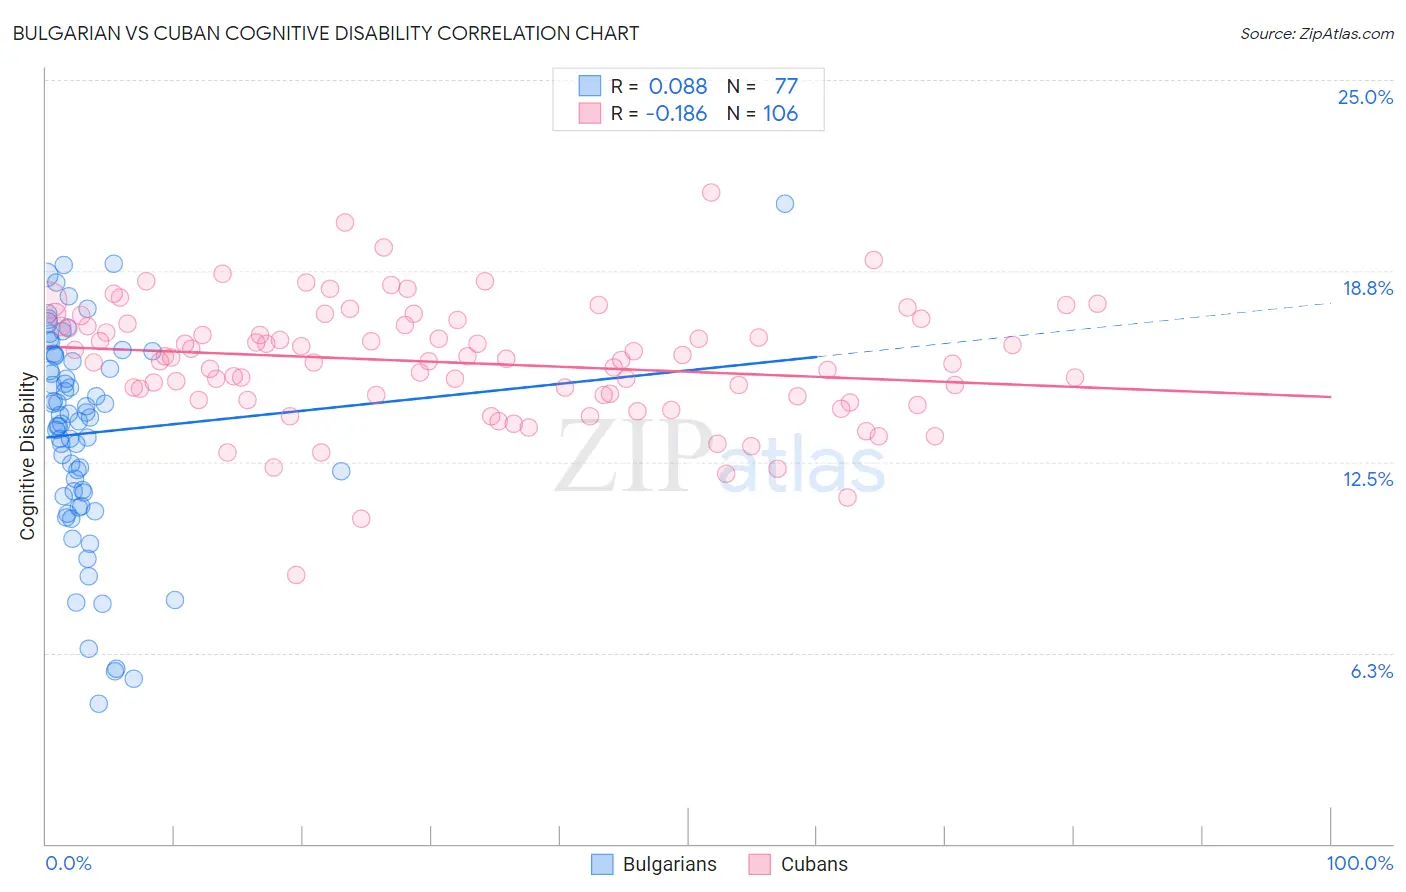
Bulgarian vs Cuban Cognitive Disability Correlation Chart
The statistical analysis conducted on geographies consisting of 205,630,797 people shows a slight positive correlation between the proportion of Bulgarians and percentage of population with cognitive disability in the United States with a correlation coefficient (R) of 0.088 and weighted average of 16.3%. Similarly, the statistical analysis conducted on geographies consisting of 449,269,783 people shows a poor negative correlation between the proportion of Cubans and percentage of population with cognitive disability in the United States with a correlation coefficient (R) of -0.186 and weighted average of 16.5%, a difference of 0.85%.
Cognitive Disability Correlation Summary
| Measurement | Bulgarian | Cuban |
| Minimum | 4.6% | 8.8% |
| Maximum | 20.9% | 21.3% |
| Range | 16.4% | 12.5% |
| Mean | 13.4% | 15.7% |
| Median | 14.0% | 15.9% |
| Interquartile 25% (IQ1) | 11.4% | 14.7% |
| Interquartile 75% (IQ3) | 16.0% | 17.0% |
| Interquartile Range (IQR) | 4.6% | 2.3% |
| Standard Deviation (Sample) | 3.4% | 2.0% |
| Standard Deviation (Population) | 3.4% | 2.0% |
Similar Demographics by Cognitive Disability
Demographics Similar to Bulgarians by Cognitive Disability
In terms of cognitive disability, the demographic groups most similar to Bulgarians are Immigrants from Bolivia (16.3%, a difference of 0.010%), Immigrants from Northern Europe (16.3%, a difference of 0.020%), Immigrants from Cuba (16.3%, a difference of 0.040%), Immigrants from North Macedonia (16.3%, a difference of 0.080%), and Eastern European (16.3%, a difference of 0.10%).
| Demographics | Rating | Rank | Cognitive Disability |
| Lithuanians | 100.0 /100 | #13 | Exceptional 16.3% |
| Immigrants | Austria | 100.0 /100 | #14 | Exceptional 16.3% |
| Immigrants | Greece | 100.0 /100 | #15 | Exceptional 16.3% |
| Eastern Europeans | 100.0 /100 | #16 | Exceptional 16.3% |
| Immigrants | North Macedonia | 100.0 /100 | #17 | Exceptional 16.3% |
| Immigrants | Northern Europe | 100.0 /100 | #18 | Exceptional 16.3% |
| Immigrants | Bolivia | 100.0 /100 | #19 | Exceptional 16.3% |
| Bulgarians | 100.0 /100 | #20 | Exceptional 16.3% |
| Immigrants | Cuba | 100.0 /100 | #21 | Exceptional 16.3% |
| Immigrants | South Central Asia | 99.9 /100 | #22 | Exceptional 16.4% |
| Croatians | 99.9 /100 | #23 | Exceptional 16.4% |
| Immigrants | Argentina | 99.9 /100 | #24 | Exceptional 16.4% |
| Luxembourgers | 99.9 /100 | #25 | Exceptional 16.4% |
| Immigrants | Croatia | 99.9 /100 | #26 | Exceptional 16.4% |
| Immigrants | Pakistan | 99.9 /100 | #27 | Exceptional 16.4% |
Demographics Similar to Cubans by Cognitive Disability
In terms of cognitive disability, the demographic groups most similar to Cubans are Immigrants from Belarus (16.5%, a difference of 0.0%), Hungarian (16.5%, a difference of 0.010%), Bolivian (16.5%, a difference of 0.020%), Immigrants from Canada (16.5%, a difference of 0.080%), and Immigrants from Eastern Europe (16.5%, a difference of 0.090%).
| Demographics | Rating | Rank | Cognitive Disability |
| Russians | 99.9 /100 | #34 | Exceptional 16.4% |
| Slovaks | 99.9 /100 | #35 | Exceptional 16.4% |
| Greeks | 99.9 /100 | #36 | Exceptional 16.4% |
| Slovenes | 99.9 /100 | #37 | Exceptional 16.5% |
| Immigrants | Eastern Europe | 99.9 /100 | #38 | Exceptional 16.5% |
| Bolivians | 99.9 /100 | #39 | Exceptional 16.5% |
| Immigrants | Belarus | 99.9 /100 | #40 | Exceptional 16.5% |
| Cubans | 99.9 /100 | #41 | Exceptional 16.5% |
| Hungarians | 99.9 /100 | #42 | Exceptional 16.5% |
| Immigrants | Canada | 99.8 /100 | #43 | Exceptional 16.5% |
| Macedonians | 99.8 /100 | #44 | Exceptional 16.5% |
| Immigrants | Europe | 99.8 /100 | #45 | Exceptional 16.5% |
| Immigrants | Colombia | 99.8 /100 | #46 | Exceptional 16.5% |
| Immigrants | Italy | 99.8 /100 | #47 | Exceptional 16.5% |
| Immigrants | North America | 99.8 /100 | #48 | Exceptional 16.5% |