Immigrants from Afghanistan vs Immigrants from Kenya Cognitive Disability
COMPARE
Immigrants from Afghanistan
Immigrants from Kenya
Cognitive Disability
Cognitive Disability Comparison
Immigrants from Afghanistan
Immigrants from Kenya
17.5%
COGNITIVE DISABILITY
16.7/ 100
METRIC RATING
197th/ 347
METRIC RANK
18.3%
COGNITIVE DISABILITY
0.0/ 100
METRIC RATING
303rd/ 347
METRIC RANK
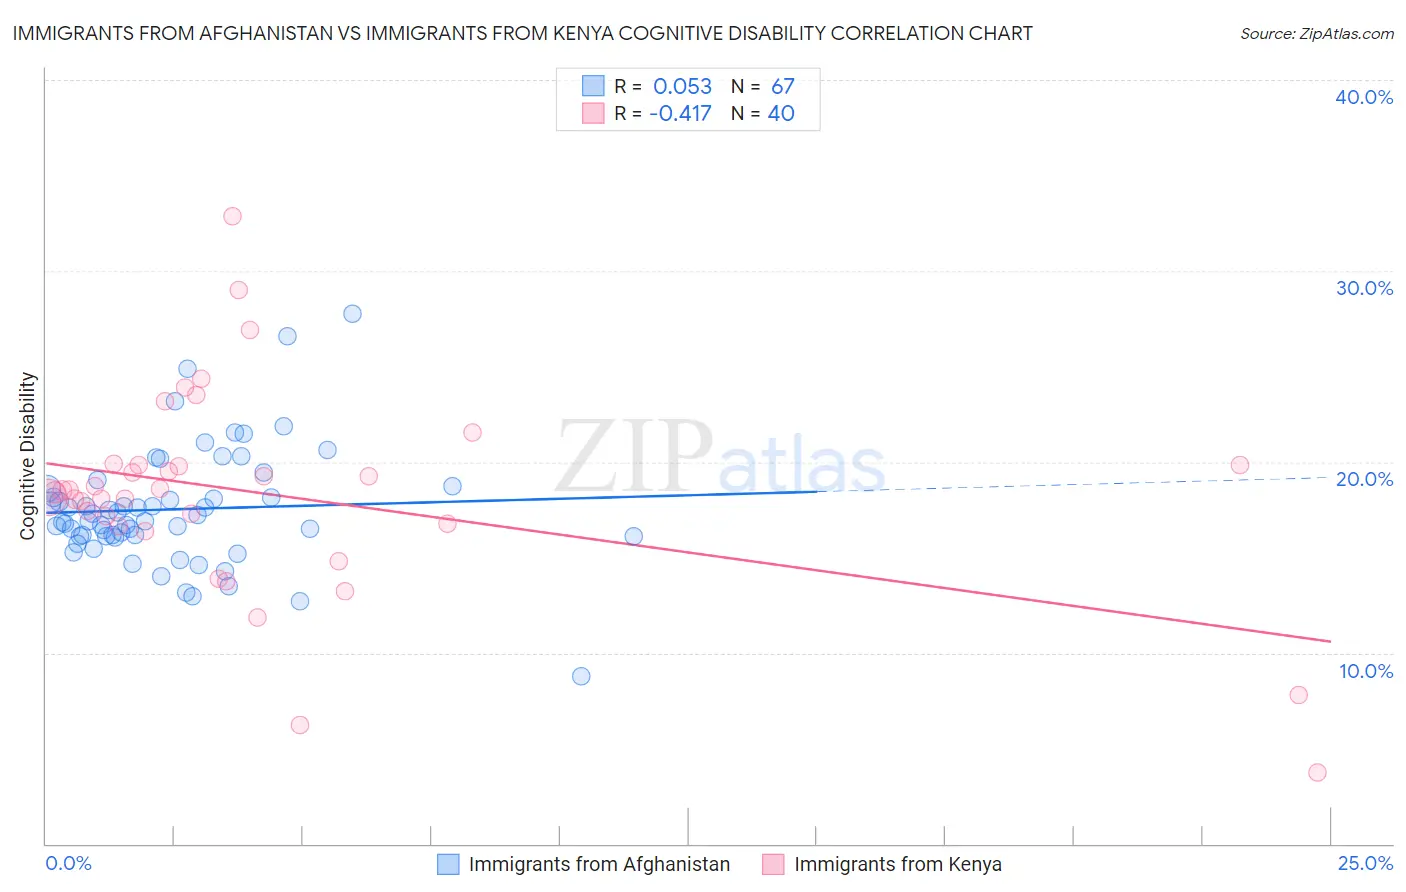
Immigrants from Afghanistan vs Immigrants from Kenya Cognitive Disability Correlation Chart
The statistical analysis conducted on geographies consisting of 147,641,735 people shows a slight positive correlation between the proportion of Immigrants from Afghanistan and percentage of population with cognitive disability in the United States with a correlation coefficient (R) of 0.053 and weighted average of 17.5%. Similarly, the statistical analysis conducted on geographies consisting of 218,057,168 people shows a moderate negative correlation between the proportion of Immigrants from Kenya and percentage of population with cognitive disability in the United States with a correlation coefficient (R) of -0.417 and weighted average of 18.3%, a difference of 4.8%.
Cognitive Disability Correlation Summary
| Measurement | Immigrants from Afghanistan | Immigrants from Kenya |
| Minimum | 8.8% | 3.7% |
| Maximum | 27.8% | 32.8% |
| Range | 19.0% | 29.1% |
| Mean | 17.5% | 18.3% |
| Median | 16.9% | 18.5% |
| Interquartile 25% (IQ1) | 16.1% | 16.7% |
| Interquartile 75% (IQ3) | 18.6% | 19.8% |
| Interquartile Range (IQR) | 2.5% | 3.1% |
| Standard Deviation (Sample) | 3.1% | 5.4% |
| Standard Deviation (Population) | 3.1% | 5.3% |
Similar Demographics by Cognitive Disability
Demographics Similar to Immigrants from Afghanistan by Cognitive Disability
In terms of cognitive disability, the demographic groups most similar to Immigrants from Afghanistan are Guyanese (17.5%, a difference of 0.040%), Immigrants from Panama (17.5%, a difference of 0.10%), Immigrants from Singapore (17.5%, a difference of 0.13%), Haitian (17.5%, a difference of 0.14%), and New Zealander (17.4%, a difference of 0.20%).
| Demographics | Rating | Rank | Cognitive Disability |
| Immigrants | Spain | 27.7 /100 | #190 | Fair 17.4% |
| Immigrants | Nonimmigrants | 27.4 /100 | #191 | Fair 17.4% |
| Immigrants | Haiti | 27.1 /100 | #192 | Fair 17.4% |
| Delaware | 25.6 /100 | #193 | Fair 17.4% |
| Immigrants | Bosnia and Herzegovina | 22.0 /100 | #194 | Fair 17.4% |
| New Zealanders | 21.1 /100 | #195 | Fair 17.4% |
| Guyanese | 17.5 /100 | #196 | Poor 17.5% |
| Immigrants | Afghanistan | 16.7 /100 | #197 | Poor 17.5% |
| Immigrants | Panama | 14.8 /100 | #198 | Poor 17.5% |
| Immigrants | Singapore | 14.3 /100 | #199 | Poor 17.5% |
| Haitians | 14.1 /100 | #200 | Poor 17.5% |
| South American Indians | 13.0 /100 | #201 | Poor 17.5% |
| Immigrants | Morocco | 12.0 /100 | #202 | Poor 17.5% |
| Immigrants | Caribbean | 11.0 /100 | #203 | Poor 17.5% |
| Immigrants | Zimbabwe | 11.0 /100 | #204 | Poor 17.5% |
Demographics Similar to Immigrants from Kenya by Cognitive Disability
In terms of cognitive disability, the demographic groups most similar to Immigrants from Kenya are Barbadian (18.3%, a difference of 0.010%), Immigrants from Eritrea (18.3%, a difference of 0.050%), Immigrants from Ghana (18.3%, a difference of 0.090%), Colville (18.3%, a difference of 0.17%), and Seminole (18.3%, a difference of 0.18%).
| Demographics | Rating | Rank | Cognitive Disability |
| Immigrants | Burma/Myanmar | 0.0 /100 | #296 | Tragic 18.2% |
| Blackfeet | 0.0 /100 | #297 | Tragic 18.3% |
| Japanese | 0.0 /100 | #298 | Tragic 18.3% |
| Ghanaians | 0.0 /100 | #299 | Tragic 18.3% |
| Creek | 0.0 /100 | #300 | Tragic 18.3% |
| Immigrants | Ghana | 0.0 /100 | #301 | Tragic 18.3% |
| Barbadians | 0.0 /100 | #302 | Tragic 18.3% |
| Immigrants | Kenya | 0.0 /100 | #303 | Tragic 18.3% |
| Immigrants | Eritrea | 0.0 /100 | #304 | Tragic 18.3% |
| Colville | 0.0 /100 | #305 | Tragic 18.3% |
| Seminole | 0.0 /100 | #306 | Tragic 18.3% |
| Ugandans | 0.0 /100 | #307 | Tragic 18.3% |
| Immigrants | Western Africa | 0.0 /100 | #308 | Tragic 18.4% |
| Immigrants | Eastern Africa | 0.0 /100 | #309 | Tragic 18.4% |
| Choctaw | 0.0 /100 | #310 | Tragic 18.4% |