Spanish vs Immigrants from Kenya Cognitive Disability
COMPARE
Spanish
Immigrants from Kenya
Cognitive Disability
Cognitive Disability Comparison
Spanish
Immigrants from Kenya
17.3%
COGNITIVE DISABILITY
48.9/ 100
METRIC RATING
178th/ 347
METRIC RANK
18.3%
COGNITIVE DISABILITY
0.0/ 100
METRIC RATING
303rd/ 347
METRIC RANK
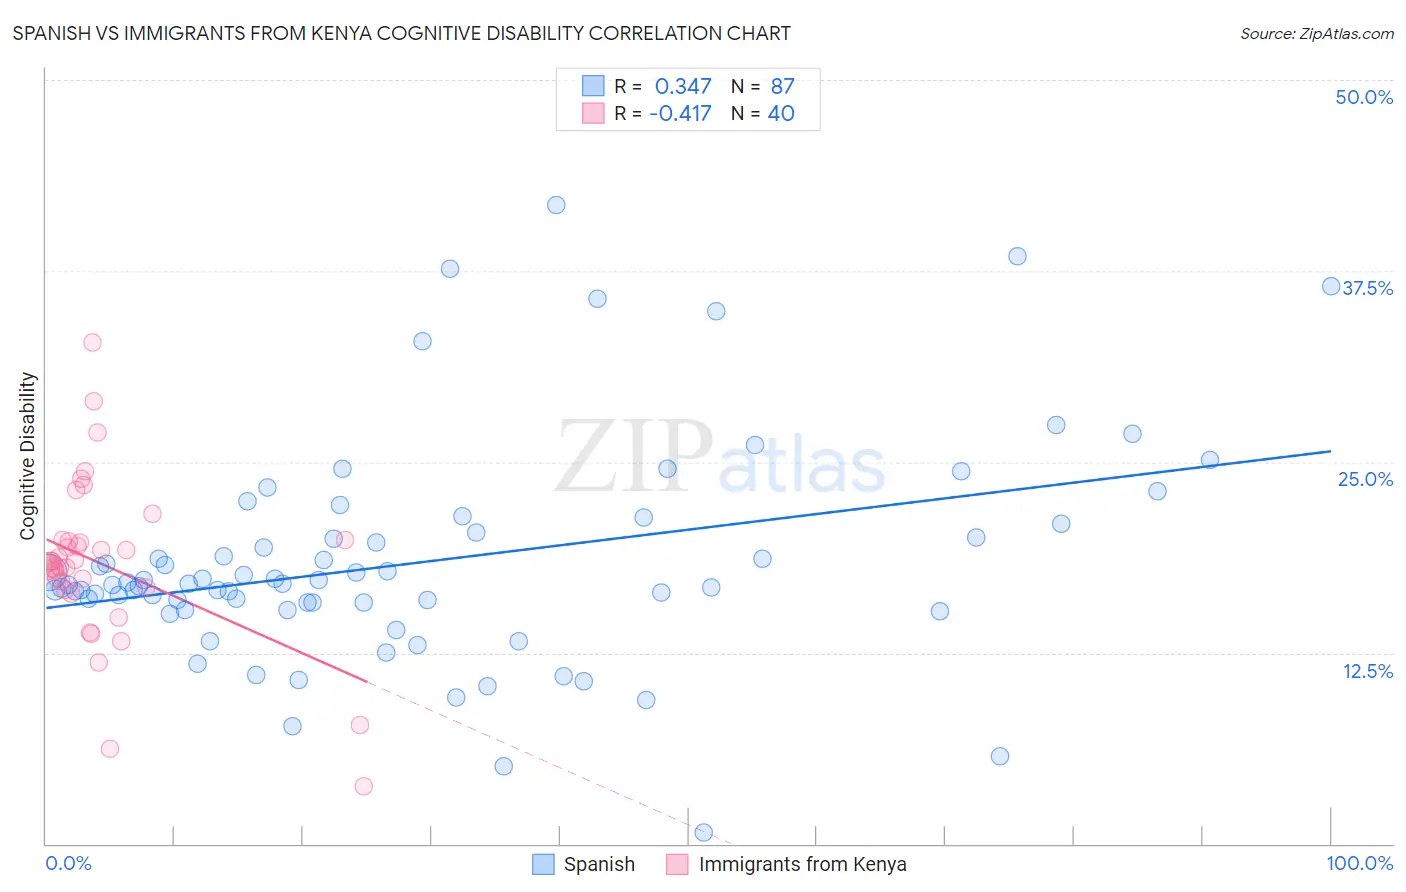
Spanish vs Immigrants from Kenya Cognitive Disability Correlation Chart
The statistical analysis conducted on geographies consisting of 422,108,205 people shows a mild positive correlation between the proportion of Spanish and percentage of population with cognitive disability in the United States with a correlation coefficient (R) of 0.347 and weighted average of 17.3%. Similarly, the statistical analysis conducted on geographies consisting of 218,057,168 people shows a moderate negative correlation between the proportion of Immigrants from Kenya and percentage of population with cognitive disability in the United States with a correlation coefficient (R) of -0.417 and weighted average of 18.3%, a difference of 6.0%.
Cognitive Disability Correlation Summary
| Measurement | Spanish | Immigrants from Kenya |
| Minimum | 0.76% | 3.7% |
| Maximum | 41.8% | 32.8% |
| Range | 41.1% | 29.1% |
| Mean | 18.4% | 18.3% |
| Median | 17.0% | 18.5% |
| Interquartile 25% (IQ1) | 15.8% | 16.7% |
| Interquartile 75% (IQ3) | 20.4% | 19.8% |
| Interquartile Range (IQR) | 4.6% | 3.1% |
| Standard Deviation (Sample) | 7.2% | 5.4% |
| Standard Deviation (Population) | 7.2% | 5.3% |
Similar Demographics by Cognitive Disability
Demographics Similar to Spanish by Cognitive Disability
In terms of cognitive disability, the demographic groups most similar to Spanish are Ute (17.3%, a difference of 0.0%), Shoshone (17.3%, a difference of 0.010%), Sioux (17.3%, a difference of 0.010%), Tsimshian (17.3%, a difference of 0.020%), and Laotian (17.3%, a difference of 0.030%).
| Demographics | Rating | Rank | Cognitive Disability |
| Tlingit-Haida | 59.4 /100 | #171 | Average 17.2% |
| Immigrants | Turkey | 56.7 /100 | #172 | Average 17.2% |
| Immigrants | Northern Africa | 50.2 /100 | #173 | Average 17.3% |
| Laotians | 50.0 /100 | #174 | Average 17.3% |
| Tsimshian | 49.8 /100 | #175 | Average 17.3% |
| Shoshone | 49.2 /100 | #176 | Average 17.3% |
| Ute | 49.1 /100 | #177 | Average 17.3% |
| Spanish | 48.9 /100 | #178 | Average 17.3% |
| Sioux | 48.6 /100 | #179 | Average 17.3% |
| Pakistanis | 43.9 /100 | #180 | Average 17.3% |
| Immigrants | Guyana | 42.9 /100 | #181 | Average 17.3% |
| Arabs | 42.8 /100 | #182 | Average 17.3% |
| Spaniards | 40.3 /100 | #183 | Average 17.3% |
| Crow | 39.1 /100 | #184 | Fair 17.3% |
| Afghans | 38.2 /100 | #185 | Fair 17.3% |
Demographics Similar to Immigrants from Kenya by Cognitive Disability
In terms of cognitive disability, the demographic groups most similar to Immigrants from Kenya are Barbadian (18.3%, a difference of 0.010%), Immigrants from Eritrea (18.3%, a difference of 0.050%), Immigrants from Ghana (18.3%, a difference of 0.090%), Colville (18.3%, a difference of 0.17%), and Seminole (18.3%, a difference of 0.18%).
| Demographics | Rating | Rank | Cognitive Disability |
| Immigrants | Burma/Myanmar | 0.0 /100 | #296 | Tragic 18.2% |
| Blackfeet | 0.0 /100 | #297 | Tragic 18.3% |
| Japanese | 0.0 /100 | #298 | Tragic 18.3% |
| Ghanaians | 0.0 /100 | #299 | Tragic 18.3% |
| Creek | 0.0 /100 | #300 | Tragic 18.3% |
| Immigrants | Ghana | 0.0 /100 | #301 | Tragic 18.3% |
| Barbadians | 0.0 /100 | #302 | Tragic 18.3% |
| Immigrants | Kenya | 0.0 /100 | #303 | Tragic 18.3% |
| Immigrants | Eritrea | 0.0 /100 | #304 | Tragic 18.3% |
| Colville | 0.0 /100 | #305 | Tragic 18.3% |
| Seminole | 0.0 /100 | #306 | Tragic 18.3% |
| Ugandans | 0.0 /100 | #307 | Tragic 18.3% |
| Immigrants | Western Africa | 0.0 /100 | #308 | Tragic 18.4% |
| Immigrants | Eastern Africa | 0.0 /100 | #309 | Tragic 18.4% |
| Choctaw | 0.0 /100 | #310 | Tragic 18.4% |