Bulgarian vs Immigrants from Europe College, Under 1 year
COMPARE
Bulgarian
Immigrants from Europe
College, Under 1 year
College, Under 1 year Comparison
Bulgarians
Immigrants from Europe
71.1%
COLLEGE, UNDER 1 YEAR
100.0/ 100
METRIC RATING
25th/ 347
METRIC RANK
68.8%
COLLEGE, UNDER 1 YEAR
99.1/ 100
METRIC RATING
71st/ 347
METRIC RANK
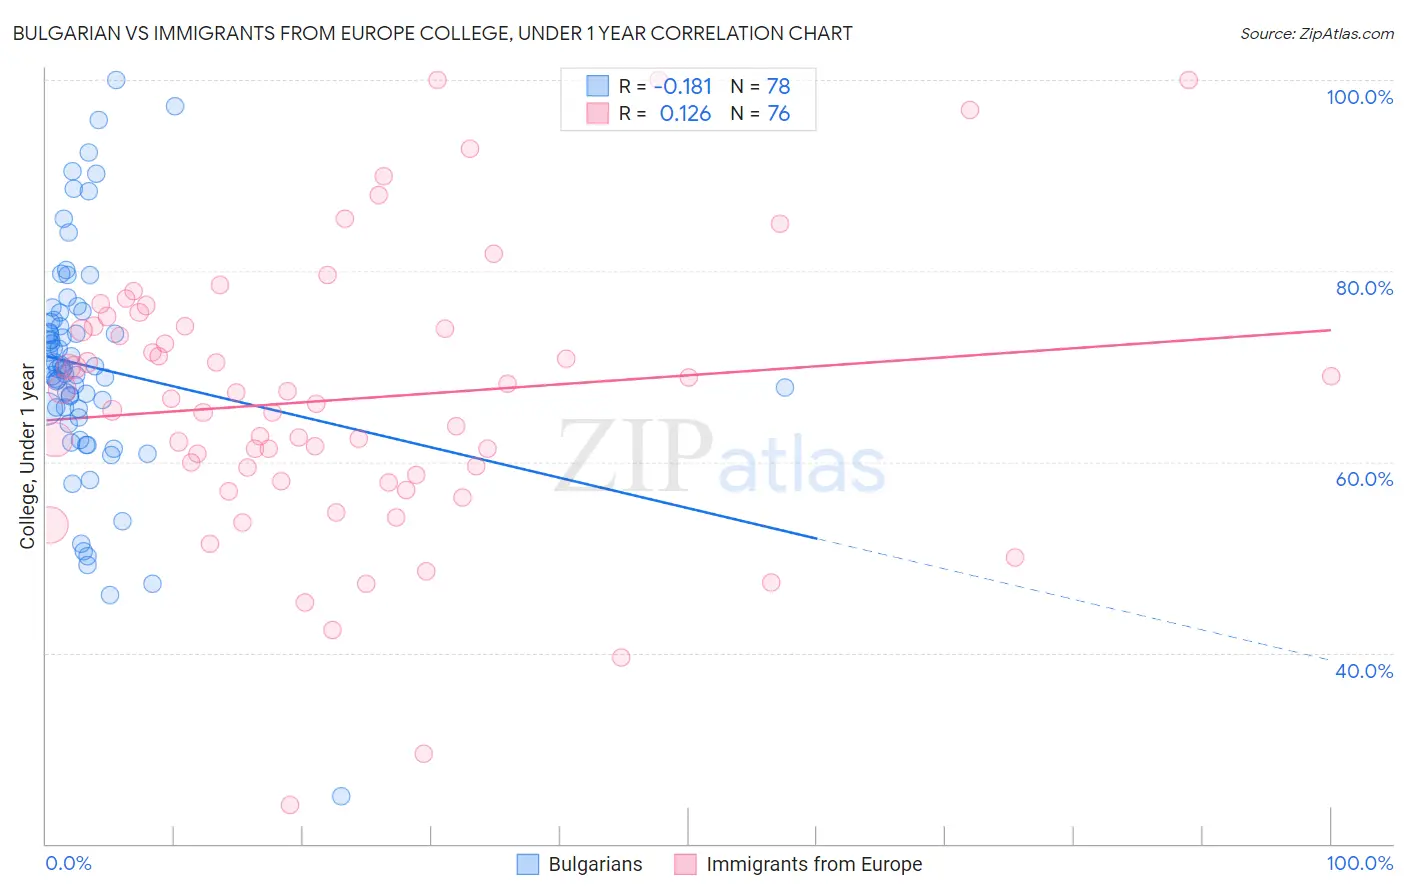
Bulgarian vs Immigrants from Europe College, Under 1 year Correlation Chart
The statistical analysis conducted on geographies consisting of 205,631,725 people shows a poor negative correlation between the proportion of Bulgarians and percentage of population with at least college, under 1 year education in the United States with a correlation coefficient (R) of -0.181 and weighted average of 71.1%. Similarly, the statistical analysis conducted on geographies consisting of 547,420,628 people shows a poor positive correlation between the proportion of Immigrants from Europe and percentage of population with at least college, under 1 year education in the United States with a correlation coefficient (R) of 0.126 and weighted average of 68.8%, a difference of 3.4%.
College, Under 1 year Correlation Summary
| Measurement | Bulgarian | Immigrants from Europe |
| Minimum | 25.0% | 24.0% |
| Maximum | 100.0% | 100.0% |
| Range | 75.0% | 76.0% |
| Mean | 70.0% | 66.5% |
| Median | 69.8% | 66.3% |
| Interquartile 25% (IQ1) | 65.6% | 58.3% |
| Interquartile 75% (IQ3) | 74.8% | 74.2% |
| Interquartile Range (IQR) | 9.3% | 16.0% |
| Standard Deviation (Sample) | 12.2% | 14.7% |
| Standard Deviation (Population) | 12.1% | 14.6% |
Similar Demographics by College, Under 1 year
Demographics Similar to Bulgarians by College, Under 1 year
In terms of college, under 1 year, the demographic groups most similar to Bulgarians are Soviet Union (71.1%, a difference of 0.020%), Immigrants from Northern Europe (71.1%, a difference of 0.030%), Immigrants from Denmark (71.0%, a difference of 0.12%), Immigrants from Ireland (71.0%, a difference of 0.13%), and Immigrants from Hong Kong (71.0%, a difference of 0.15%).
| Demographics | Rating | Rank | College, Under 1 year |
| Immigrants | Switzerland | 100.0 /100 | #18 | Exceptional 71.7% |
| Latvians | 100.0 /100 | #19 | Exceptional 71.6% |
| Immigrants | Korea | 100.0 /100 | #20 | Exceptional 71.6% |
| Immigrants | Belgium | 100.0 /100 | #21 | Exceptional 71.5% |
| Immigrants | Eastern Asia | 100.0 /100 | #22 | Exceptional 71.3% |
| Immigrants | Northern Europe | 100.0 /100 | #23 | Exceptional 71.1% |
| Soviet Union | 100.0 /100 | #24 | Exceptional 71.1% |
| Bulgarians | 100.0 /100 | #25 | Exceptional 71.1% |
| Immigrants | Denmark | 100.0 /100 | #26 | Exceptional 71.0% |
| Immigrants | Ireland | 100.0 /100 | #27 | Exceptional 71.0% |
| Immigrants | Hong Kong | 100.0 /100 | #28 | Exceptional 71.0% |
| Immigrants | France | 100.0 /100 | #29 | Exceptional 71.0% |
| Immigrants | China | 99.9 /100 | #30 | Exceptional 70.9% |
| Indians (Asian) | 99.9 /100 | #31 | Exceptional 70.8% |
| Turks | 99.9 /100 | #32 | Exceptional 70.7% |
Demographics Similar to Immigrants from Europe by College, Under 1 year
In terms of college, under 1 year, the demographic groups most similar to Immigrants from Europe are Lithuanian (68.8%, a difference of 0.010%), Bolivian (68.7%, a difference of 0.040%), Immigrants from England (68.7%, a difference of 0.080%), Swedish (68.7%, a difference of 0.14%), and Immigrants from Romania (68.9%, a difference of 0.18%).
| Demographics | Rating | Rank | College, Under 1 year |
| Northern Europeans | 99.4 /100 | #64 | Exceptional 69.0% |
| Immigrants | Moldova | 99.3 /100 | #65 | Exceptional 69.0% |
| Immigrants | North America | 99.3 /100 | #66 | Exceptional 69.0% |
| Immigrants | Zimbabwe | 99.2 /100 | #67 | Exceptional 68.9% |
| Immigrants | Indonesia | 99.2 /100 | #68 | Exceptional 68.9% |
| Immigrants | Romania | 99.2 /100 | #69 | Exceptional 68.9% |
| Lithuanians | 99.1 /100 | #70 | Exceptional 68.8% |
| Immigrants | Europe | 99.1 /100 | #71 | Exceptional 68.8% |
| Bolivians | 99.0 /100 | #72 | Exceptional 68.7% |
| Immigrants | England | 99.0 /100 | #73 | Exceptional 68.7% |
| Swedes | 98.9 /100 | #74 | Exceptional 68.7% |
| Immigrants | Western Europe | 98.6 /100 | #75 | Exceptional 68.5% |
| Laotians | 98.6 /100 | #76 | Exceptional 68.5% |
| British | 98.6 /100 | #77 | Exceptional 68.5% |
| Danes | 98.6 /100 | #78 | Exceptional 68.5% |