British West Indian vs Native/Alaskan Disability Age Under 5
COMPARE
British West Indian
Native/Alaskan
Disability Age Under 5
Disability Age Under 5 Comparison
British West Indians
Natives/Alaskans
0.99%
DISABILITY AGE UNDER 5
100.0/ 100
METRIC RATING
21st/ 347
METRIC RANK
1.9%
DISABILITY AGE UNDER 5
0.0/ 100
METRIC RATING
334th/ 347
METRIC RANK
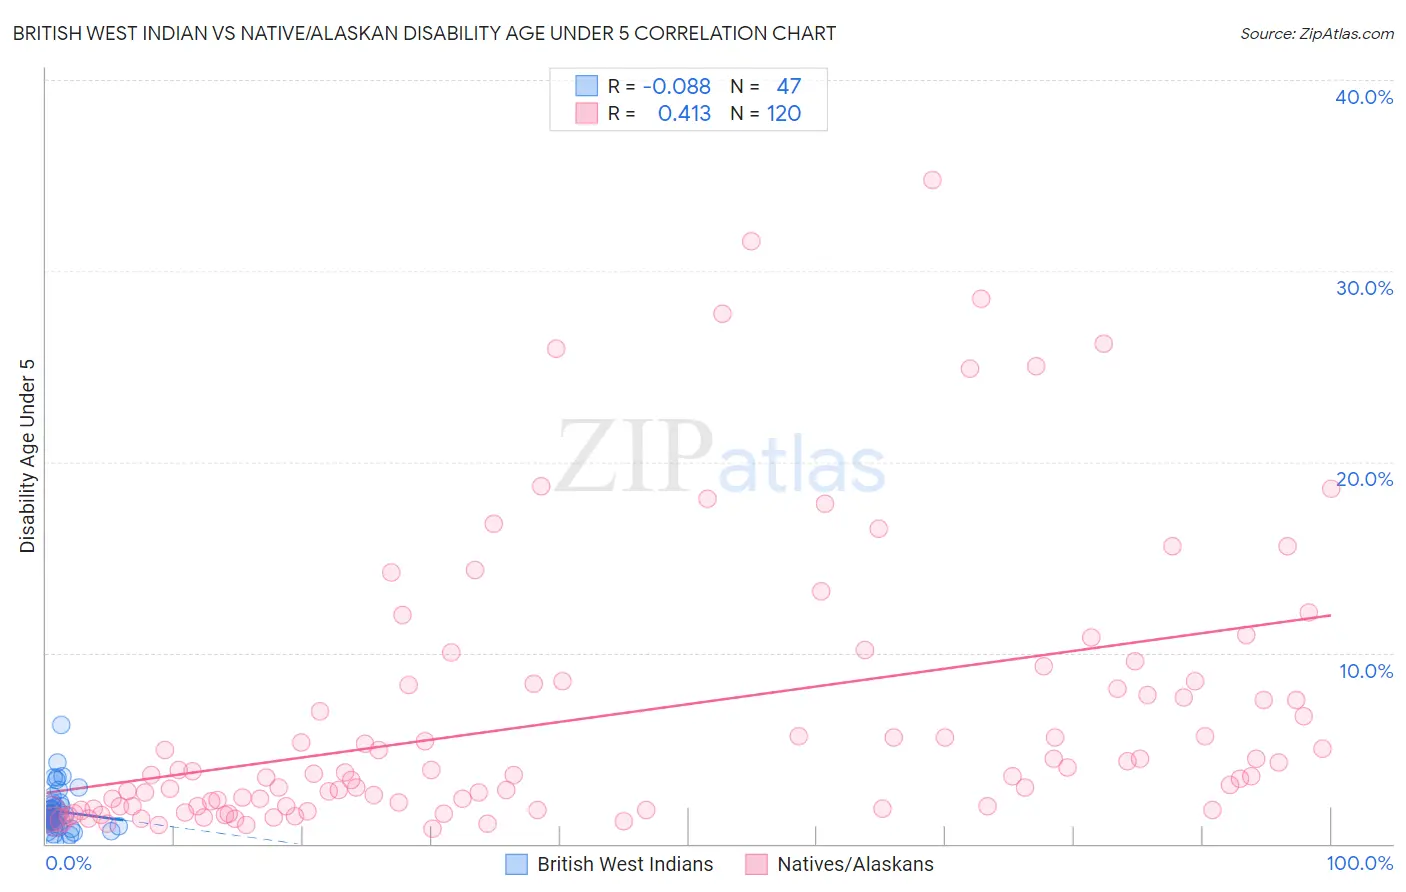
British West Indian vs Native/Alaskan Disability Age Under 5 Correlation Chart
The statistical analysis conducted on geographies consisting of 105,175,944 people shows a slight negative correlation between the proportion of British West Indians and percentage of population with a disability under the age of 5 in the United States with a correlation coefficient (R) of -0.088 and weighted average of 0.99%. Similarly, the statistical analysis conducted on geographies consisting of 253,755,946 people shows a moderate positive correlation between the proportion of Natives/Alaskans and percentage of population with a disability under the age of 5 in the United States with a correlation coefficient (R) of 0.413 and weighted average of 1.9%, a difference of 96.1%.
Disability Age Under 5 Correlation Summary
| Measurement | British West Indian | Native/Alaskan |
| Minimum | 0.12% | 0.79% |
| Maximum | 6.2% | 34.8% |
| Range | 6.1% | 34.0% |
| Mean | 1.7% | 6.7% |
| Median | 1.5% | 3.6% |
| Interquartile 25% (IQ1) | 1.0% | 2.0% |
| Interquartile 75% (IQ3) | 2.0% | 8.4% |
| Interquartile Range (IQR) | 0.98% | 6.4% |
| Standard Deviation (Sample) | 1.1% | 7.3% |
| Standard Deviation (Population) | 1.1% | 7.3% |
Similar Demographics by Disability Age Under 5
Demographics Similar to British West Indians by Disability Age Under 5
In terms of disability age under 5, the demographic groups most similar to British West Indians are Immigrants from Iran (1.00%, a difference of 0.79%), Yakama (1.00%, a difference of 0.87%), Indian (Asian) (1.0%, a difference of 1.1%), Immigrants from Micronesia (1.0%, a difference of 1.5%), and Immigrants from Taiwan (1.0%, a difference of 1.6%).
| Demographics | Rating | Rank | Disability Age Under 5 |
| Yuman | 100.0 /100 | #14 | Exceptional 0.95% |
| Immigrants | Hong Kong | 100.0 /100 | #15 | Exceptional 0.95% |
| Immigrants | Israel | 100.0 /100 | #16 | Exceptional 0.96% |
| Immigrants | China | 100.0 /100 | #17 | Exceptional 0.96% |
| Immigrants | Barbados | 100.0 /100 | #18 | Exceptional 0.97% |
| Puget Sound Salish | 100.0 /100 | #19 | Exceptional 0.97% |
| Nepalese | 100.0 /100 | #20 | Exceptional 0.97% |
| British West Indians | 100.0 /100 | #21 | Exceptional 0.99% |
| Immigrants | Iran | 100.0 /100 | #22 | Exceptional 1.00% |
| Yakama | 100.0 /100 | #23 | Exceptional 1.00% |
| Indians (Asian) | 100.0 /100 | #24 | Exceptional 1.0% |
| Immigrants | Micronesia | 100.0 /100 | #25 | Exceptional 1.0% |
| Immigrants | Taiwan | 100.0 /100 | #26 | Exceptional 1.0% |
| Guyanese | 100.0 /100 | #27 | Exceptional 1.0% |
| Immigrants | Eastern Asia | 100.0 /100 | #28 | Exceptional 1.0% |
Demographics Similar to Natives/Alaskans by Disability Age Under 5
In terms of disability age under 5, the demographic groups most similar to Natives/Alaskans are Pennsylvania German (1.9%, a difference of 0.38%), Dutch West Indian (1.9%, a difference of 0.40%), Paraguayan (2.0%, a difference of 1.7%), Chippewa (1.9%, a difference of 3.4%), and French Canadian (1.9%, a difference of 3.4%).
| Demographics | Rating | Rank | Disability Age Under 5 |
| Osage | 0.0 /100 | #327 | Tragic 1.8% |
| Americans | 0.0 /100 | #328 | Tragic 1.9% |
| Houma | 0.0 /100 | #329 | Tragic 1.9% |
| Choctaw | 0.0 /100 | #330 | Tragic 1.9% |
| French Canadians | 0.0 /100 | #331 | Tragic 1.9% |
| Chippewa | 0.0 /100 | #332 | Tragic 1.9% |
| Dutch West Indians | 0.0 /100 | #333 | Tragic 1.9% |
| Natives/Alaskans | 0.0 /100 | #334 | Tragic 1.9% |
| Pennsylvania Germans | 0.0 /100 | #335 | Tragic 1.9% |
| Paraguayans | 0.0 /100 | #336 | Tragic 2.0% |
| Apache | 0.0 /100 | #337 | Tragic 2.0% |
| Tohono O'odham | 0.0 /100 | #338 | Tragic 2.2% |
| Immigrants | Azores | 0.0 /100 | #339 | Tragic 2.2% |
| Menominee | 0.0 /100 | #340 | Tragic 2.3% |
| Tsimshian | 0.0 /100 | #341 | Tragic 2.4% |