Immigrants from Asia vs Native/Alaskan Disability Age Under 5
COMPARE
Immigrants from Asia
Native/Alaskan
Disability Age Under 5
Disability Age Under 5 Comparison
Immigrants from Asia
Natives/Alaskans
1.1%
DISABILITY AGE UNDER 5
99.8/ 100
METRIC RATING
44th/ 347
METRIC RANK
1.9%
DISABILITY AGE UNDER 5
0.0/ 100
METRIC RATING
334th/ 347
METRIC RANK
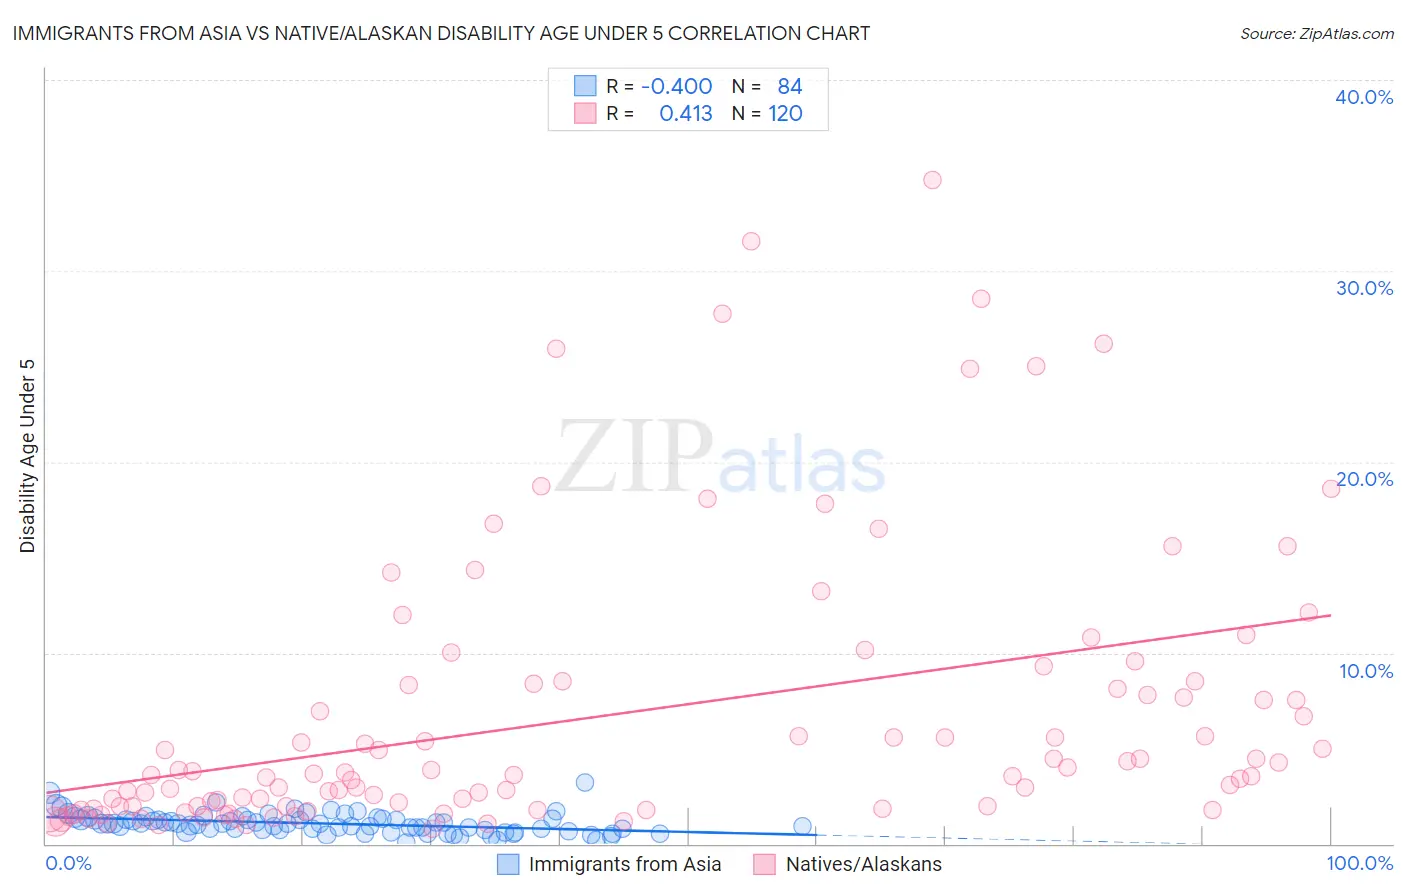
Immigrants from Asia vs Native/Alaskan Disability Age Under 5 Correlation Chart
The statistical analysis conducted on geographies consisting of 258,370,039 people shows a moderate negative correlation between the proportion of Immigrants from Asia and percentage of population with a disability under the age of 5 in the United States with a correlation coefficient (R) of -0.400 and weighted average of 1.1%. Similarly, the statistical analysis conducted on geographies consisting of 253,755,946 people shows a moderate positive correlation between the proportion of Natives/Alaskans and percentage of population with a disability under the age of 5 in the United States with a correlation coefficient (R) of 0.413 and weighted average of 1.9%, a difference of 82.9%.
Disability Age Under 5 Correlation Summary
| Measurement | Immigrants from Asia | Native/Alaskan |
| Minimum | 0.058% | 0.79% |
| Maximum | 3.2% | 34.8% |
| Range | 3.2% | 34.0% |
| Mean | 1.1% | 6.7% |
| Median | 1.0% | 3.6% |
| Interquartile 25% (IQ1) | 0.72% | 2.0% |
| Interquartile 75% (IQ3) | 1.3% | 8.4% |
| Interquartile Range (IQR) | 0.57% | 6.4% |
| Standard Deviation (Sample) | 0.53% | 7.3% |
| Standard Deviation (Population) | 0.53% | 7.3% |
Similar Demographics by Disability Age Under 5
Demographics Similar to Immigrants from Asia by Disability Age Under 5
In terms of disability age under 5, the demographic groups most similar to Immigrants from Asia are Pima (1.1%, a difference of 0.090%), Immigrants from Bulgaria (1.1%, a difference of 0.11%), Thai (1.1%, a difference of 0.21%), Immigrants from Turkey (1.1%, a difference of 0.22%), and Immigrants from Albania (1.1%, a difference of 0.61%).
| Demographics | Rating | Rank | Disability Age Under 5 |
| Immigrants | India | 99.9 /100 | #37 | Exceptional 1.0% |
| Immigrants | Guyana | 99.9 /100 | #38 | Exceptional 1.0% |
| Filipinos | 99.9 /100 | #39 | Exceptional 1.1% |
| Immigrants | Albania | 99.9 /100 | #40 | Exceptional 1.1% |
| Thais | 99.8 /100 | #41 | Exceptional 1.1% |
| Immigrants | Bulgaria | 99.8 /100 | #42 | Exceptional 1.1% |
| Pima | 99.8 /100 | #43 | Exceptional 1.1% |
| Immigrants | Asia | 99.8 /100 | #44 | Exceptional 1.1% |
| Immigrants | Turkey | 99.8 /100 | #45 | Exceptional 1.1% |
| Immigrants | Congo | 99.8 /100 | #46 | Exceptional 1.1% |
| Immigrants | Sweden | 99.8 /100 | #47 | Exceptional 1.1% |
| Immigrants | Singapore | 99.7 /100 | #48 | Exceptional 1.1% |
| Immigrants | Russia | 99.7 /100 | #49 | Exceptional 1.1% |
| Immigrants | Japan | 99.7 /100 | #50 | Exceptional 1.1% |
| Immigrants | Kazakhstan | 99.7 /100 | #51 | Exceptional 1.1% |
Demographics Similar to Natives/Alaskans by Disability Age Under 5
In terms of disability age under 5, the demographic groups most similar to Natives/Alaskans are Pennsylvania German (1.9%, a difference of 0.38%), Dutch West Indian (1.9%, a difference of 0.40%), Paraguayan (2.0%, a difference of 1.7%), Chippewa (1.9%, a difference of 3.4%), and French Canadian (1.9%, a difference of 3.4%).
| Demographics | Rating | Rank | Disability Age Under 5 |
| Osage | 0.0 /100 | #327 | Tragic 1.8% |
| Americans | 0.0 /100 | #328 | Tragic 1.9% |
| Houma | 0.0 /100 | #329 | Tragic 1.9% |
| Choctaw | 0.0 /100 | #330 | Tragic 1.9% |
| French Canadians | 0.0 /100 | #331 | Tragic 1.9% |
| Chippewa | 0.0 /100 | #332 | Tragic 1.9% |
| Dutch West Indians | 0.0 /100 | #333 | Tragic 1.9% |
| Natives/Alaskans | 0.0 /100 | #334 | Tragic 1.9% |
| Pennsylvania Germans | 0.0 /100 | #335 | Tragic 1.9% |
| Paraguayans | 0.0 /100 | #336 | Tragic 2.0% |
| Apache | 0.0 /100 | #337 | Tragic 2.0% |
| Tohono O'odham | 0.0 /100 | #338 | Tragic 2.2% |
| Immigrants | Azores | 0.0 /100 | #339 | Tragic 2.2% |
| Menominee | 0.0 /100 | #340 | Tragic 2.3% |
| Tsimshian | 0.0 /100 | #341 | Tragic 2.4% |