Hispanic or Latino vs Native/Alaskan Disability Age Under 5
COMPARE
Hispanic or Latino
Native/Alaskan
Disability Age Under 5
Disability Age Under 5 Comparison
Hispanics or Latinos
Natives/Alaskans
1.3%
DISABILITY AGE UNDER 5
7.7/ 100
METRIC RATING
223rd/ 347
METRIC RANK
1.9%
DISABILITY AGE UNDER 5
0.0/ 100
METRIC RATING
334th/ 347
METRIC RANK
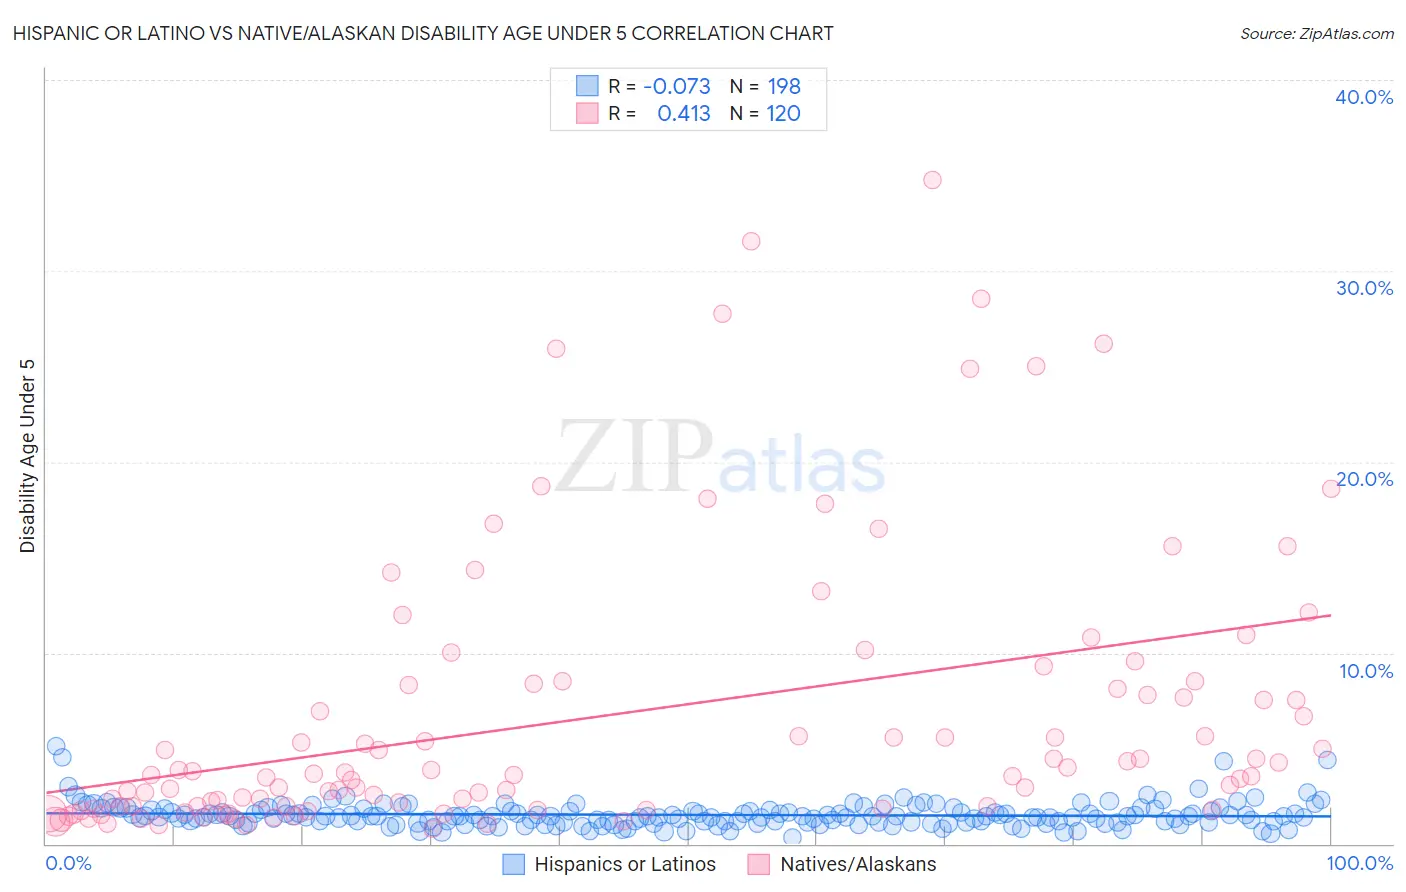
Hispanic or Latino vs Native/Alaskan Disability Age Under 5 Correlation Chart
The statistical analysis conducted on geographies consisting of 261,565,458 people shows a slight negative correlation between the proportion of Hispanics or Latinos and percentage of population with a disability under the age of 5 in the United States with a correlation coefficient (R) of -0.073 and weighted average of 1.3%. Similarly, the statistical analysis conducted on geographies consisting of 253,755,946 people shows a moderate positive correlation between the proportion of Natives/Alaskans and percentage of population with a disability under the age of 5 in the United States with a correlation coefficient (R) of 0.413 and weighted average of 1.9%, a difference of 48.3%.
Disability Age Under 5 Correlation Summary
| Measurement | Hispanic or Latino | Native/Alaskan |
| Minimum | 0.35% | 0.79% |
| Maximum | 5.1% | 34.8% |
| Range | 4.8% | 34.0% |
| Mean | 1.5% | 6.7% |
| Median | 1.4% | 3.6% |
| Interquartile 25% (IQ1) | 1.1% | 2.0% |
| Interquartile 75% (IQ3) | 1.7% | 8.4% |
| Interquartile Range (IQR) | 0.61% | 6.4% |
| Standard Deviation (Sample) | 0.65% | 7.3% |
| Standard Deviation (Population) | 0.65% | 7.3% |
Similar Demographics by Disability Age Under 5
Demographics Similar to Hispanics or Latinos by Disability Age Under 5
In terms of disability age under 5, the demographic groups most similar to Hispanics or Latinos are Latvian (1.3%, a difference of 0.16%), Subsaharan African (1.3%, a difference of 0.19%), Ukrainian (1.3%, a difference of 0.19%), Panamanian (1.3%, a difference of 0.19%), and Bahamian (1.3%, a difference of 0.19%).
| Demographics | Rating | Rank | Disability Age Under 5 |
| Bangladeshis | 15.5 /100 | #216 | Poor 1.3% |
| Cypriots | 14.9 /100 | #217 | Poor 1.3% |
| Malaysians | 13.2 /100 | #218 | Poor 1.3% |
| Immigrants | Croatia | 11.2 /100 | #219 | Poor 1.3% |
| Serbians | 9.6 /100 | #220 | Tragic 1.3% |
| Sub-Saharan Africans | 8.3 /100 | #221 | Tragic 1.3% |
| Ukrainians | 8.3 /100 | #222 | Tragic 1.3% |
| Hispanics or Latinos | 7.7 /100 | #223 | Tragic 1.3% |
| Latvians | 7.1 /100 | #224 | Tragic 1.3% |
| Panamanians | 7.1 /100 | #225 | Tragic 1.3% |
| Bahamians | 7.1 /100 | #226 | Tragic 1.3% |
| Taiwanese | 6.1 /100 | #227 | Tragic 1.3% |
| Luxembourgers | 6.1 /100 | #228 | Tragic 1.3% |
| Immigrants | Costa Rica | 5.5 /100 | #229 | Tragic 1.3% |
| Lebanese | 5.3 /100 | #230 | Tragic 1.3% |
Demographics Similar to Natives/Alaskans by Disability Age Under 5
In terms of disability age under 5, the demographic groups most similar to Natives/Alaskans are Pennsylvania German (1.9%, a difference of 0.38%), Dutch West Indian (1.9%, a difference of 0.40%), Paraguayan (2.0%, a difference of 1.7%), Chippewa (1.9%, a difference of 3.4%), and French Canadian (1.9%, a difference of 3.4%).
| Demographics | Rating | Rank | Disability Age Under 5 |
| Osage | 0.0 /100 | #327 | Tragic 1.8% |
| Americans | 0.0 /100 | #328 | Tragic 1.9% |
| Houma | 0.0 /100 | #329 | Tragic 1.9% |
| Choctaw | 0.0 /100 | #330 | Tragic 1.9% |
| French Canadians | 0.0 /100 | #331 | Tragic 1.9% |
| Chippewa | 0.0 /100 | #332 | Tragic 1.9% |
| Dutch West Indians | 0.0 /100 | #333 | Tragic 1.9% |
| Natives/Alaskans | 0.0 /100 | #334 | Tragic 1.9% |
| Pennsylvania Germans | 0.0 /100 | #335 | Tragic 1.9% |
| Paraguayans | 0.0 /100 | #336 | Tragic 2.0% |
| Apache | 0.0 /100 | #337 | Tragic 2.0% |
| Tohono O'odham | 0.0 /100 | #338 | Tragic 2.2% |
| Immigrants | Azores | 0.0 /100 | #339 | Tragic 2.2% |
| Menominee | 0.0 /100 | #340 | Tragic 2.3% |
| Tsimshian | 0.0 /100 | #341 | Tragic 2.4% |