British West Indian vs Native/Alaskan 10th Grade
COMPARE
British West Indian
Native/Alaskan
10th Grade
10th Grade Comparison
British West Indians
Natives/Alaskans
91.8%
10TH GRADE
0.0/ 100
METRIC RATING
290th/ 347
METRIC RANK
92.2%
10TH GRADE
0.1/ 100
METRIC RATING
279th/ 347
METRIC RANK
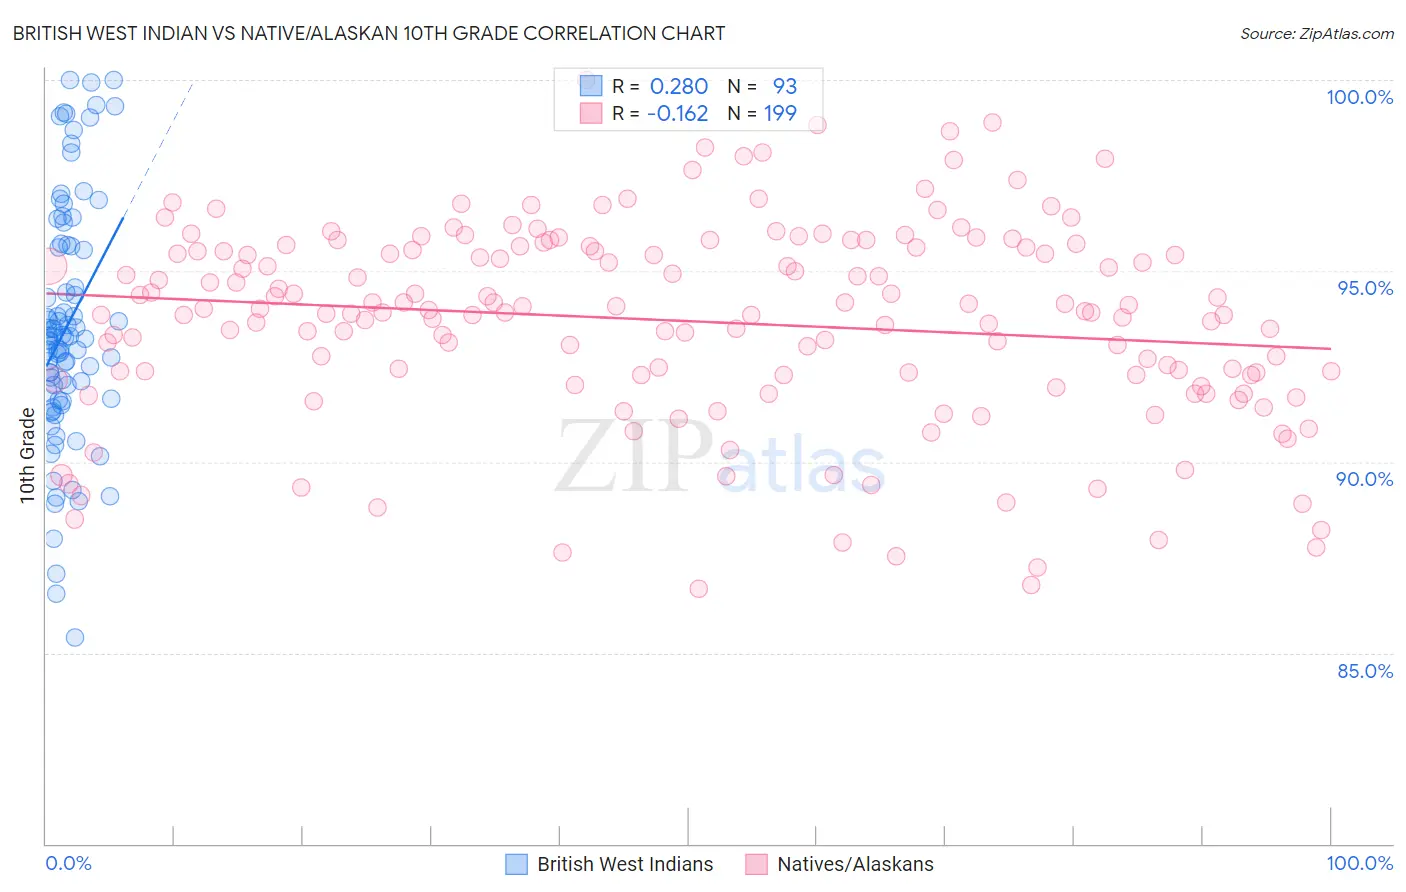
British West Indian vs Native/Alaskan 10th Grade Correlation Chart
The statistical analysis conducted on geographies consisting of 152,698,597 people shows a weak positive correlation between the proportion of British West Indians and percentage of population with at least 10th grade education in the United States with a correlation coefficient (R) of 0.280 and weighted average of 91.8%. Similarly, the statistical analysis conducted on geographies consisting of 513,060,394 people shows a poor negative correlation between the proportion of Natives/Alaskans and percentage of population with at least 10th grade education in the United States with a correlation coefficient (R) of -0.162 and weighted average of 92.2%, a difference of 0.42%.
10th Grade Correlation Summary
| Measurement | British West Indian | Native/Alaskan |
| Minimum | 85.4% | 86.7% |
| Maximum | 100.0% | 100.0% |
| Range | 14.6% | 13.3% |
| Mean | 93.5% | 93.7% |
| Median | 93.2% | 93.9% |
| Interquartile 25% (IQ1) | 91.6% | 92.3% |
| Interquartile 75% (IQ3) | 95.7% | 95.6% |
| Interquartile Range (IQR) | 4.0% | 3.3% |
| Standard Deviation (Sample) | 3.2% | 2.6% |
| Standard Deviation (Population) | 3.1% | 2.6% |
Demographics Similar to British West Indians and Natives/Alaskans by 10th Grade
In terms of 10th grade, the demographic groups most similar to British West Indians are Immigrants from West Indies (91.8%, a difference of 0.0%), Immigrants from Burma/Myanmar (91.8%, a difference of 0.010%), Sri Lankan (91.8%, a difference of 0.020%), Indonesian (91.8%, a difference of 0.030%), and Pennsylvania German (91.9%, a difference of 0.060%). Similarly, the demographic groups most similar to Natives/Alaskans are Barbadian (92.2%, a difference of 0.010%), Malaysian (92.2%, a difference of 0.030%), Navajo (92.3%, a difference of 0.040%), Bangladeshi (92.2%, a difference of 0.040%), and Immigrants from Peru (92.2%, a difference of 0.060%).
| Demographics | Rating | Rank | 10th Grade |
| Immigrants | Congo | 0.2 /100 | #274 | Tragic 92.4% |
| West Indians | 0.2 /100 | #275 | Tragic 92.4% |
| Immigrants | Trinidad and Tobago | 0.1 /100 | #276 | Tragic 92.3% |
| Navajo | 0.1 /100 | #277 | Tragic 92.3% |
| Barbadians | 0.1 /100 | #278 | Tragic 92.2% |
| Natives/Alaskans | 0.1 /100 | #279 | Tragic 92.2% |
| Malaysians | 0.1 /100 | #280 | Tragic 92.2% |
| Bangladeshis | 0.1 /100 | #281 | Tragic 92.2% |
| Immigrants | Peru | 0.1 /100 | #282 | Tragic 92.2% |
| Immigrants | St. Vincent and the Grenadines | 0.0 /100 | #283 | Tragic 92.1% |
| Immigrants | Barbados | 0.0 /100 | #284 | Tragic 92.1% |
| Immigrants | South Eastern Asia | 0.0 /100 | #285 | Tragic 92.1% |
| Yuman | 0.0 /100 | #286 | Tragic 92.0% |
| Pennsylvania Germans | 0.0 /100 | #287 | Tragic 91.9% |
| Immigrants | Laos | 0.0 /100 | #288 | Tragic 91.9% |
| Sri Lankans | 0.0 /100 | #289 | Tragic 91.8% |
| British West Indians | 0.0 /100 | #290 | Tragic 91.8% |
| Immigrants | West Indies | 0.0 /100 | #291 | Tragic 91.8% |
| Immigrants | Burma/Myanmar | 0.0 /100 | #292 | Tragic 91.8% |
| Indonesians | 0.0 /100 | #293 | Tragic 91.8% |
| Haitians | 0.0 /100 | #294 | Tragic 91.8% |