British West Indian vs Native/Alaskan Unemployment Among Ages 30 to 34 years
COMPARE
British West Indian
Native/Alaskan
Unemployment Among Ages 30 to 34 years
Unemployment Among Ages 30 to 34 years Comparison
British West Indians
Natives/Alaskans
7.0%
UNEMPLOYMENT AMONG AGES 30 TO 34 YEARS
0.0/ 100
METRIC RATING
312th/ 347
METRIC RANK
8.2%
UNEMPLOYMENT AMONG AGES 30 TO 34 YEARS
0.0/ 100
METRIC RATING
332nd/ 347
METRIC RANK
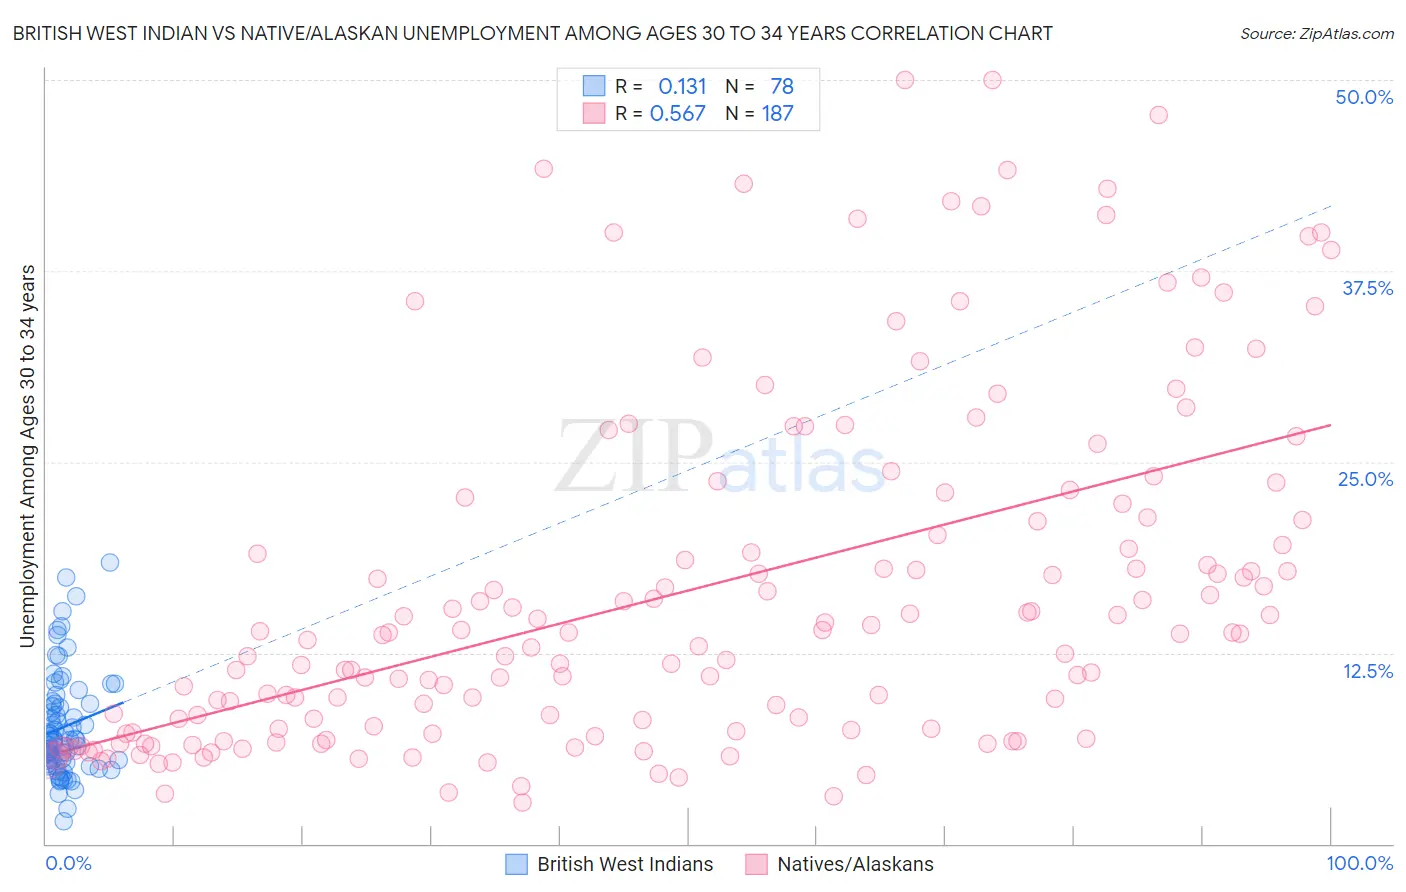
British West Indian vs Native/Alaskan Unemployment Among Ages 30 to 34 years Correlation Chart
The statistical analysis conducted on geographies consisting of 149,857,863 people shows a poor positive correlation between the proportion of British West Indians and unemployment rate among population between the ages 30 and 34 in the United States with a correlation coefficient (R) of 0.131 and weighted average of 7.0%. Similarly, the statistical analysis conducted on geographies consisting of 466,883,769 people shows a substantial positive correlation between the proportion of Natives/Alaskans and unemployment rate among population between the ages 30 and 34 in the United States with a correlation coefficient (R) of 0.567 and weighted average of 8.2%, a difference of 17.0%.
Unemployment Among Ages 30 to 34 years Correlation Summary
| Measurement | British West Indian | Native/Alaskan |
| Minimum | 1.5% | 2.7% |
| Maximum | 18.4% | 50.0% |
| Range | 16.9% | 47.3% |
| Mean | 7.7% | 16.5% |
| Median | 6.8% | 13.7% |
| Interquartile 25% (IQ1) | 5.3% | 7.4% |
| Interquartile 75% (IQ3) | 9.2% | 21.4% |
| Interquartile Range (IQR) | 3.9% | 14.0% |
| Standard Deviation (Sample) | 3.4% | 11.3% |
| Standard Deviation (Population) | 3.4% | 11.3% |
Demographics Similar to British West Indians and Natives/Alaskans by Unemployment Among Ages 30 to 34 years
In terms of unemployment among ages 30 to 34 years, the demographic groups most similar to British West Indians are Ute (7.0%, a difference of 0.040%), Lumbee (7.1%, a difference of 0.25%), Aleut (7.1%, a difference of 0.62%), Houma (7.2%, a difference of 1.6%), and Immigrants from Cabo Verde (7.2%, a difference of 1.9%). Similarly, the demographic groups most similar to Natives/Alaskans are Sioux (8.0%, a difference of 2.6%), Shoshone (7.9%, a difference of 4.1%), Cheyenne (7.8%, a difference of 5.1%), Chippewa (7.8%, a difference of 6.2%), and Immigrants from Dominican Republic (7.7%, a difference of 6.4%).
| Demographics | Rating | Rank | Unemployment Among Ages 30 to 34 years |
| British West Indians | 0.0 /100 | #312 | Tragic 7.0% |
| Ute | 0.0 /100 | #313 | Tragic 7.0% |
| Lumbee | 0.0 /100 | #314 | Tragic 7.1% |
| Aleuts | 0.0 /100 | #315 | Tragic 7.1% |
| Houma | 0.0 /100 | #316 | Tragic 7.2% |
| Immigrants | Cabo Verde | 0.0 /100 | #317 | Tragic 7.2% |
| Blacks/African Americans | 0.0 /100 | #318 | Tragic 7.2% |
| Guyanese | 0.0 /100 | #319 | Tragic 7.2% |
| Cape Verdeans | 0.0 /100 | #320 | Tragic 7.2% |
| Immigrants | Guyana | 0.0 /100 | #321 | Tragic 7.2% |
| Marshallese | 0.0 /100 | #322 | Tragic 7.2% |
| Immigrants | Yemen | 0.0 /100 | #323 | Tragic 7.3% |
| Immigrants | Dominica | 0.0 /100 | #324 | Tragic 7.3% |
| Apache | 0.0 /100 | #325 | Tragic 7.3% |
| Dominicans | 0.0 /100 | #326 | Tragic 7.7% |
| Immigrants | Dominican Republic | 0.0 /100 | #327 | Tragic 7.7% |
| Chippewa | 0.0 /100 | #328 | Tragic 7.8% |
| Cheyenne | 0.0 /100 | #329 | Tragic 7.8% |
| Shoshone | 0.0 /100 | #330 | Tragic 7.9% |
| Sioux | 0.0 /100 | #331 | Tragic 8.0% |
| Natives/Alaskans | 0.0 /100 | #332 | Tragic 8.2% |