Pakistani vs Immigrants from Switzerland Male Disability
COMPARE
Pakistani
Immigrants from Switzerland
Male Disability
Male Disability Comparison
Pakistanis
Immigrants from Switzerland
11.3%
MALE DISABILITY
30.3/ 100
METRIC RATING
185th/ 347
METRIC RANK
10.7%
MALE DISABILITY
96.1/ 100
METRIC RATING
99th/ 347
METRIC RANK
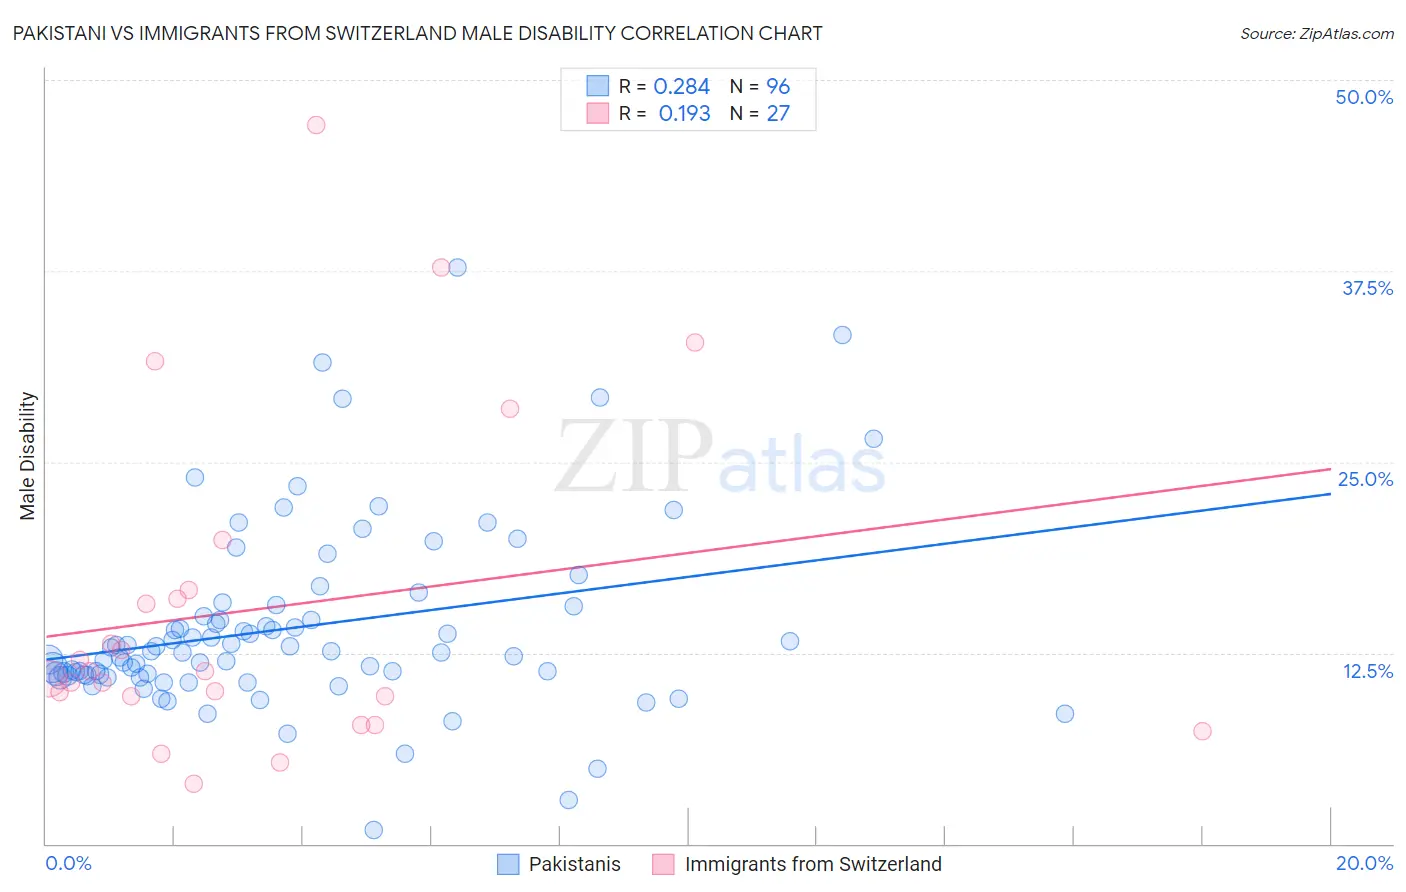
Pakistani vs Immigrants from Switzerland Male Disability Correlation Chart
The statistical analysis conducted on geographies consisting of 335,283,610 people shows a weak positive correlation between the proportion of Pakistanis and percentage of males with a disability in the United States with a correlation coefficient (R) of 0.284 and weighted average of 11.3%. Similarly, the statistical analysis conducted on geographies consisting of 148,082,366 people shows a poor positive correlation between the proportion of Immigrants from Switzerland and percentage of males with a disability in the United States with a correlation coefficient (R) of 0.193 and weighted average of 10.7%, a difference of 5.9%.
Male Disability Correlation Summary
| Measurement | Pakistani | Immigrants from Switzerland |
| Minimum | 0.92% | 4.0% |
| Maximum | 37.8% | 47.1% |
| Range | 36.8% | 43.1% |
| Mean | 14.1% | 15.4% |
| Median | 12.5% | 11.3% |
| Interquartile 25% (IQ1) | 11.0% | 9.6% |
| Interquartile 75% (IQ3) | 15.2% | 16.6% |
| Interquartile Range (IQR) | 4.2% | 7.0% |
| Standard Deviation (Sample) | 6.1% | 10.8% |
| Standard Deviation (Population) | 6.0% | 10.6% |
Similar Demographics by Male Disability
Demographics Similar to Pakistanis by Male Disability
In terms of male disability, the demographic groups most similar to Pakistanis are Iraqi (11.3%, a difference of 0.010%), Immigrants from Central America (11.3%, a difference of 0.16%), Immigrants from Zaire (11.4%, a difference of 0.18%), Immigrants from Austria (11.4%, a difference of 0.20%), and Immigrants from Belize (11.3%, a difference of 0.21%).
| Demographics | Rating | Rank | Male Disability |
| Australians | 42.2 /100 | #178 | Average 11.3% |
| Immigrants | Caribbean | 41.4 /100 | #179 | Average 11.3% |
| Hondurans | 41.1 /100 | #180 | Average 11.3% |
| Immigrants | Senegal | 34.4 /100 | #181 | Fair 11.3% |
| Immigrants | Belize | 33.7 /100 | #182 | Fair 11.3% |
| Immigrants | Central America | 32.9 /100 | #183 | Fair 11.3% |
| Iraqis | 30.5 /100 | #184 | Fair 11.3% |
| Pakistanis | 30.3 /100 | #185 | Fair 11.3% |
| Immigrants | Zaire | 27.6 /100 | #186 | Fair 11.4% |
| Immigrants | Austria | 27.3 /100 | #187 | Fair 11.4% |
| Estonians | 26.8 /100 | #188 | Fair 11.4% |
| Immigrants | Netherlands | 25.9 /100 | #189 | Fair 11.4% |
| Immigrants | Bosnia and Herzegovina | 25.4 /100 | #190 | Fair 11.4% |
| Senegalese | 23.2 /100 | #191 | Fair 11.4% |
| Assyrians/Chaldeans/Syriacs | 23.2 /100 | #192 | Fair 11.4% |
Demographics Similar to Immigrants from Switzerland by Male Disability
In terms of male disability, the demographic groups most similar to Immigrants from Switzerland are Immigrants from Kazakhstan (10.7%, a difference of 0.070%), Immigrants from Romania (10.7%, a difference of 0.14%), Immigrants from Greece (10.7%, a difference of 0.18%), Immigrants from Armenia (10.7%, a difference of 0.20%), and Nicaraguan (10.7%, a difference of 0.22%).
| Demographics | Rating | Rank | Male Disability |
| Palestinians | 97.4 /100 | #92 | Exceptional 10.7% |
| Immigrants | St. Vincent and the Grenadines | 97.1 /100 | #93 | Exceptional 10.7% |
| Immigrants | Sweden | 96.9 /100 | #94 | Exceptional 10.7% |
| Chileans | 96.9 /100 | #95 | Exceptional 10.7% |
| Nicaraguans | 96.6 /100 | #96 | Exceptional 10.7% |
| Immigrants | Armenia | 96.6 /100 | #97 | Exceptional 10.7% |
| Immigrants | Romania | 96.5 /100 | #98 | Exceptional 10.7% |
| Immigrants | Switzerland | 96.1 /100 | #99 | Exceptional 10.7% |
| Immigrants | Kazakhstan | 95.9 /100 | #100 | Exceptional 10.7% |
| Immigrants | Greece | 95.6 /100 | #101 | Exceptional 10.7% |
| Immigrants | Eastern Europe | 95.3 /100 | #102 | Exceptional 10.7% |
| Uruguayans | 95.3 /100 | #103 | Exceptional 10.7% |
| Immigrants | Nigeria | 95.1 /100 | #104 | Exceptional 10.8% |
| Immigrants | Brazil | 95.0 /100 | #105 | Exceptional 10.8% |
| Immigrants | Syria | 94.9 /100 | #106 | Exceptional 10.8% |